
2025–2026 Investment Stewardship Report
This document outlines Royal Gold, Inc.'s strategies and initiatives for responsible investment stewardship during the fiscal years 2025-2026.
2025-2026 Investment Stewardship Report
Table of Contents 3 A Letter From the CEO 4 A Message From Our Chair About Royal Gold 6 About This Report 7 2025 Milestones 8 Our Business 11 Global Portfolio Map 12 Principal Property Stewardship Highlights 18 Principles of Investment Stewardship 20 Year in Review: Investment Stewardship Risk Discussion 26 Investor Engagement and Priorities Assessment Governance 30 Governance 31 Investment Stewardship Governance 34 Investment Stewardship Policies 35 Due Diligence and Portfolio Monitoring 39 Cybersecurity 40 Taxes, Associations and Political Contributions Our People 42 Talent Attraction and Retention 43 Human Capital 44 Health, Safety and Wellness Supporting Operators and Communities 46 Community Investment 47 Mining Community Investment Highlights 51 Local Office Community Investment Highlights 53 Future Leaders in Responsible Mining Scholarship Investment Stewardship 56 Climate Change 61 Operator Performance 63 Human Rights 72 Safety 73 Biodiversity 75 Operator Tailings Management 76 Legal Matters Appendices 78 Corporate Performance 79 Principal Property Performance 82 Operator Production Performance 92 Operator Energy Consumption 102 Portfolio Energy Intensity Summary 104 Operator GHG Emissions 116 Operator Water Consumption 127 Operator Stewardship Framework Alignment 129 GRI Index 133 TCFD Index 134 SDG Index 135 Glossary 136 GHG Emissions Footprint Calculation Methodology Royal Gold | 2025-2026 Investment Stewardship Report 2
INTRODUCTION ABOUT ROYAL GOLD GOVERNANCE OUR PEOPLE OPERATORS AND COMMUNITIES INVESTMENT STEWARDSHIP APPENDICES To us, Investment Stewardship means the responsible allocation, management and oversight of capital to create value for our stakeholders." A Letter From the President and CEO After a year of profound change in our business through the acquisition of Sandstorm Gold and Horizon Copper, and the completion of the largest single investment made in Royal Gold’s history at Kansanshi, I wanted to take the time to address what has not changed: our approach to strategy and, within it, our continued focus on investment stewardship. Transforming the company into a much larger entity does not mean we lose sight of the detailed areas of risk that must be managed on a daily basis. If we lose that focus, we will not have succeeded in achieving our Vision of being the gold standard in all of our endeavors. I can assure you that this continued focus on investment stewardship applies to our Board as well. We continue to frame this report as a risk management product rather than a sustainability-focused publication, because the way we identify, mitigate, and reduce risk is fundamental to how we protect and grow shareholder value. We believe we have mitigated or reduced risk in our portfolio in key areas as a result of last year’s activity. We diversified our portfolio from a revenue and net asset value basis. We enhanced the growth profile of the company with the acquisition of key development projects. We saw the duration of our portfolio increase, not just associated with our acquisition activity, but also through key life of mine extension opportunities at Mount Milligan and Cortez. These positive developments were set against a very favorable metal price environment with gold and silver prices increasing on average 44% and 42% to $3,432/ ounce and $40.03/ounce, respectively. We believe a successful integration of our acquisitions and the demonstration of the combined financial strength of our much larger company will continue to generate more interest by prospective investors in Royal Gold. In terms of sustainability, our due diligence continues to not just focus on key areas such environmental and social impacts but also focuses on geology, mining and metallurgy. The due diligence assessment provides us the opportunity to best understand a project and we incorporate standards and further risk assessments when necessary, including those that may involve independent third party reviews. We aim to provide financial assistance to the operators within our portfolio to assist with their local community programs when possible. We added a new commitment in Zambia with the Kansanshi interest in 2025. All told, our contributions to operator and local community programs increased to just over $1.5 million. We also continued to expand our support of the next generation of mining engineers, adding a sixth scholarship to our record of higher education spending. This is our fifth annual report covering sustainability matters and we are continuing to build a record of consistency in areas such as reporting progress against TCFD, fully offsetting our corporate related emissions and the tracking and reporting of our Scope 3 emissions. This report does not include detailed data associated with the Sandstorm Gold and Horizon Copper acquisitions, or the Kansanshi transaction, due to the fact that these assets were not in our portfolio during 2024. We expect to fully incorporate those measures in next year’s report. Sincerely, William H. Heissenbuttel President and Chief Executive Officer Royal Gold | 2025-2026 Investment Stewardship Report 3
Royal Gold | 2025-2026 Investment Stewardship Report 4 "As we move through 2026, Royal Gold remains committed to advancing our journey toward a sustainable and resilient future, with transparency and integrity continuing to serve as the foundation of our business model." A Message From Our Chair William M. Hayes, Royal Gold Board of Directors Chair DEAR STAKEHOLDERS, As Chair of the Board of Directors, I am pleased to present our fifth annual Investment Stewardship Report. The Board plays a central role in continuing to ensure that our strategy is aligned with responsible capital allocation, effective risk management and strong governance. Investment stewardship, including sustainability, remain core priorities, guiding how we evaluate opportunities, monitor performance and support management in delivering value for our stakeholders. Following a very successful past year, we continued to strengthen our oversight of environmental and social risks and opportunities, recognizing their continued importance to long-term performance. In 2025, we remained focused on enhancing transparency, supporting responsible mining practices and monitoring portfolio risk, all while completing our most significant acquisitions to date, Sandstorm Gold and Horizon Copper along with the Kansanshi transaction. Engagement with stakeholders continues to inform our work. We value the perspectives of our investors, employees, Operators and the communities connected to our operations. Their insights help shape our priorities and reinforce our commitment to transparency and accountability. On behalf of the Board, I would like to thank our management team and employees for their dedication, and our shareholders and stakeholders for their continued trust and support. William M. Hayes Independent Board Chair INTRODUCTION ABOUT ROYAL GOLD GOVERNANCE OUR PEOPLE OPERATORS AND COMMUNITIES INVESTMENT STEWARDSHIP APPENDICES
About Royal Gold Royal Gold’s business is to acquire and manage precious metals streams, royalties and other similar production-based interests. By partnering with capable operators, we focus on building and managing a diversified, cash-flowing portfolio of precious metal properties, while also accumulating a pipeline of earlier-stage properties that are not yet cash-flowing, but have the potential to do so in the future. IN THIS SECTION 6 About This Report 7 2025 Milestones 8 Our Business 11 Global Portfolio Map 12 Principal Property Stewardship Highlights 18 Principles of Investment Stewardship 20 Year in Review: Investment Stewardship Risk Discussion 26 Investor Engagement and Priorities Assessment INTRODUCTION ABOUT ROYAL GOLD GOVERNANCE OUR PEOPLE OPERATORS AND COMMUNITIES INVESTMENT STEWARDSHIP APPENDICES Royal Gold | 2025-2026 Investment Stewardship Report 5
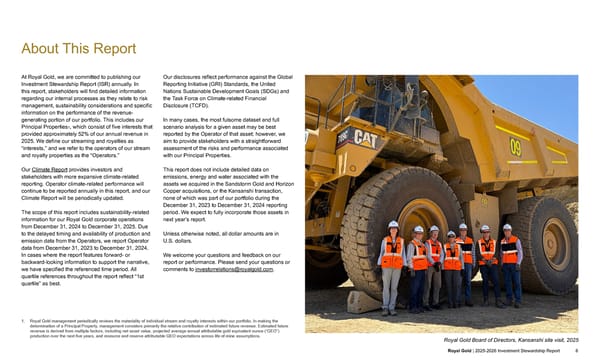
About This Report At Royal Gold, we are committed to publishing our Investment Stewardship Report (ISR) annually. In this report, stakeholders will find detailed information regarding our internal processes as they relate to risk management, sustainability considerations and specific information on the performance of the revenue- generating portion of our portfolio. This includes our Principal Properties 1 , which consist of five interests that provided approximately 52% of our annual revenue in 2025. We define our streaming and royalties as “interests,” and we refer to the operators of our stream and royalty properties as the “Operators.” Our Climate Report provides investors and stakeholders with more expansive climate-related reporting. Operator climate-related performance will continue to be reported annually in this report, and our Climate Report will be periodically updated. The scope of this report includes sustainability-related information for our Royal Gold corporate operations from December 31, 2024 to December 31, 2025. Due to the delayed timing and availability of production and emission data from the Operators, we report Operator data from December 31, 2023 to December 31, 2024. In cases where the report features forward- or backward-looking information to support the narrative, we have specified the referenced time period. All quartile references throughout the report reflect “1st quartile” as best. Our disclosures reflect performance against the Global Reporting Initiative (GRI) Standards, the United Nations Sustainable Development Goals (SDGs) and the Task Force on Climate-related Financial Disclosure (TCFD). In many cases, the most fulsome dataset and full scenario analysis for a given asset may be best reported by the Operator of that asset; however, we aim to provide stakeholders with a straightforward assessment of the risks and performance associated with our Principal Properties. This report does not include detailed data on emissions, energy and water associated with the assets we acquired in the Sandstorm Gold and Horizon Copper acquisitions, or the Kansanshi transaction, none of which was part of our portfolio during the December 31, 2023 to December 31, 2024 reporting period. We expect to fully incorporate those assets in next year’s report. Unless otherwise noted, all dollar amounts are in U.S. dollars. We welcome your questions and feedback on our report or performance. Please send your questions or comments to investorrelations@royalgold.com . INTRODUCTION ABOUT ROYAL GOLD GOVERNANCE OUR PEOPLE OPERATORS AND COMMUNITIES INVESTMENT STEWARDSHIP APPENDICES Royal Gold | 2025-2026 Investment Stewardship Report 6 1. Royal Gold management periodically reviews the materiality of individual stream and royalty interests within our portfolio. In making the determination of a Principal Property, management considers primarily the relative contribution of estimated future revenue. Estimated future revenue is derived from multiple factors, including net asset value, projected average annual attributable gold equivalent ounce (“GEO”) production over the next five years, and resource and reserve attributable GEO expectations across life of mine assumptions. Royal Gold Board of Directors, Kansanshi site visit, 2025
2025 Milestones $1.56M contributed to support organizations in our office and mining Operator communities 100% of scope 2 and 3 corporate emissions offset, achieving carbon neutrality for six consecutive years, from 2020 to 2025 1 $1B record revenue in 2025 compared to $719M in 2024, representing a 43% increase 0% annualized employee turnover rate 6 We support six universities with mining-related programs which aim to develop the next generation of leaders 5th year reporting our progress and performance against the TCFD framework 98% of scope 3 investment emissions successfully tracked and reported 1 100% Director experience in the mining industry 1. In this report, we segment scope 3 corporate emissions into those arising from our corporate activities (which we refer to as our scope 3 corporate emissions) and those of our portfolio Operators (which we refer to as our scope 3 investment emissions). We do this because as a passive investor, we do not have direct influence or control over the Operators’ emissions but do manage and assert more control over our own direct footprint. Our scope 3 corporate emissions are largely those associated with business travel and employee commuting. INTRODUCTION ABOUT ROYAL GOLD GOVERNANCE OUR PEOPLE OPERATORS AND COMMUNITIES INVESTMENT STEWARDSHIP APPENDICES Royal Gold | 2025-2026 Investment Stewardship Report 7 Solwezi, Zambia classroom, Kansanshi , 2025
Our Business Royal Gold, Inc., together with our subsidiaries (“Royal Gold,” the “Company,” “we,” “us,” and “our”), acquires and manages precious metals streams, royalties and other similar interests. Royal Gold common shares are listed on the Nasdaq Global Select Market under the symbol “RGLD”. We focus on building and managing a diversified, cash- flowing portfolio of interests in producing mines by aligning with experienced Operators while creating a pipeline of earlier-stage interests that have the potential to be cash-flowing in the future. Portfolio Manager Versus Mine Owner and Operator Royal Gold does not own, develop, or mine the properties on which we hold stream or royalty interests (except for the joint venture interest in Hod Maden); instead, our stream and royalty interests are passive interests in mine production. The properties where we hold interests span various stages of mining project development, from the initial stages of exploration and evaluation through development and production. The Operators make all development and operating decisions, and in general, we have limited to no influence regarding the development or operation of the mineral properties through the contractual arrangements we put in place, or that are already in place, when an investment is initiated and over the course of our relationship. Our management team has significant industry experience and is well equipped to evaluate new opportunities by performing project, Operator and country due diligence and to manage the existing portfolio of stream and royalty interests. Our scalable business model also allows us to effectively manage our business with a small team of professionals. INTRODUCTION ABOUT ROYAL GOLD GOVERNANCE OUR PEOPLE OPERATORS AND COMMUNITIES INVESTMENT STEWARDSHIP APPENDICES Royal Gold | 2025-2026 Investment Stewardship Report 8
Stream and royalty interests are defined as follows: ROYALTY A royalty is the right to receive a percentage or other denomination of mineral production from a mining operation, after deducting specific costs (if any). STREAM A metal stream is a purchase agreement that provides, in exchange for an upfront deposit payment, the right to purchase all or a portion of one or more metals in an amount determined by reference to production at a mining operation, at a price determined for the life of the transaction by the purchase agreement. For additional information on stream and royalty interests please refer to our Annual Report on Form 10-K. Stream and royalty interests can be acquired by Royal Gold either directly from an Operator, from a third party or through a merger or acquisition transaction. In the case of new streams or royalties that are sold to Royal Gold by an Operator to raise capital, the financing provided by Royal Gold is typically directed by Operators toward three broad uses: 1 Investing directly in mining assets (e.g., mine development and construction, mine expansion, funding exploration work) 2 Providing liquidity to strengthen Operator balance sheets 3 Funding merger and acquisition activity Royalty Versus Stream Purchase Price ROYAL GOLD ENTITY SELLER Transfer of Contractual Rights Royalty Revenue OPERATOR Advance payment to purchase percentage of metal production + delivery payment (per unit delivered) RGLD GOLD AG/ IRC STREAM OPERATOR Physical metal delivery PHASE OF PROJECT Royal Gold interests may include the right to finance future and/ or further project development Typical interest size Exploration Proceeds generally used toward exploration or early project development Development Proceeds generally used toward project development Production Proceeds generally used toward production expansion, development of new projects, or other corporate purpose ~$5M-$15M ~$50M-$300M ~$200M-$1B+ Operators ROYALTY ROYALTY STREAM STREAM Third parties ROYALTY ROYALTY ROYALTY Royal Gold’s business model is designed to provide shareholders with long-term exposure to production and exploration upside and metal price optionality for the entire life of a mining project. Resource growth and mine life extensions can significantly enhance our returns over time; accordingly, how Operators manage sustainability matters associated with their assets and business operations is fundamental to our long-term success. Royal Gold integrates sustainability considerations into our corporate practices, our investment decisions and our relationships with the Operators. INTRODUCTION ABOUT ROYAL GOLD GOVERNANCE OUR PEOPLE OPERATORS AND COMMUNITIES INVESTMENT STEWARDSHIP APPENDICES Royal Gold | 2025-2026 Investment Stewardship Report 9
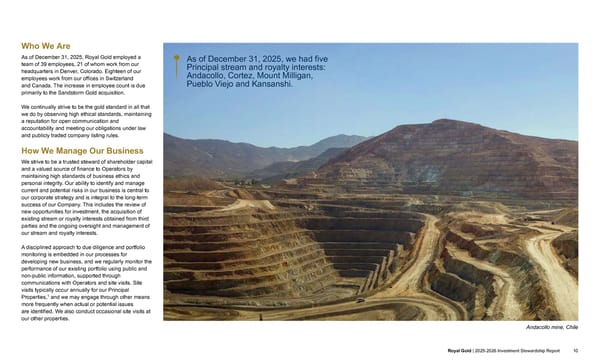
Who We Are As of December 31, 2025, Royal Gold employed a team of 39 employees, 21 of whom work from our headquarters in Denver, Colorado. Eighteen of our employees work from our offices in Switzerland and Canada. The increase in employee count is due primarily to the Sandstorm Gold acquisition. We continually strive to be the gold standard in all that we do by observing high ethical standards, maintaining a reputation for open communication and accountability and meeting our obligations under law and publicly traded company listing rules. How We Manage Our Business We strive to be a trusted steward of shareholder capital and a valued source of finance to Operators by maintaining high standards of business ethics and personal integrity. Our ability to identify and manage current and potential risks in our business is central to our corporate strategy and is integral to the long-term success of our Company. This includes the review of new opportunities for investment, the acquisition of existing stream or royalty interests obtained from third parties and the ongoing oversight and management of our stream and royalty interests. A disciplined approach to due diligence and portfolio monitoring is embedded in our processes for developing new business, and we regularly monitor the performance of our existing portfolio using public and non-public information, supported through communications with Operators and site visits. Site visits typically occur annually for our Principal Properties, 1 and we may engage through other means more frequently when actual or potential issues are identified. We also conduct occasional site visits at our other properties. INTRODUCTION ABOUT ROYAL GOLD GOVERNANCE OUR PEOPLE OPERATORS AND COMMUNITIES INVESTMENT STEWARDSHIP APPENDICES Royal Gold | 2025-2026 Investment Stewardship Report 10 As of December 31, 2025, we had five Principal stream and royalty interests: Andacollo, Cortez, Mount Milligan, Pueblo Viejo and Kansanshi. Andacollo mine, Chile
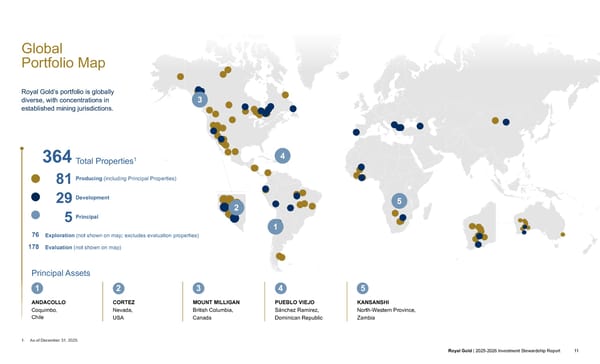
Global Portfolio Map Royal Gold’s portfolio is globally diverse, with concentrations in established mining jurisdictions. 364 Total Properties 1 81 Producing (including Principal Properties) 29 Development 5 Principal 76 Exploration (not shown on map; excludes evaluation properties) 178 Evaluation (not shown on map) Principal Assets 1 ANDACOLLO Coquimbo, Chile 2 CORTEZ Nevada, USA 3 MOUNT MILLIGAN British Columbia, Canada 4 PUEBLO VIEJO Sánchez Ramírez, Dominican Republic 5 KANSANSHI North-Western Province, Zambia 1. As of December 31, 2025. INTRODUCTION ABOUT ROYAL GOLD GOVERNANCE OUR PEOPLE OPERATORS AND COMMUNITIES INVESTMENT STEWARDSHIP APPENDICES Royal Gold | 2025-2026 Investment Stewardship Report 11
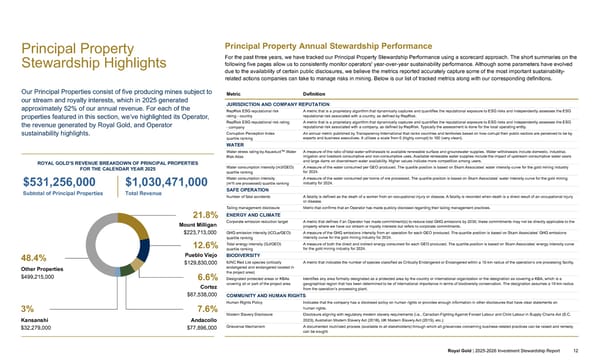
Principal Property Stewardship Highlights Our Principal Properties consist of five producing mines subject to our stream and royalty interests, which in 2025 generated approximately 52% of our annual revenue. For each of the properties featured in this section, we’ve highlighted its Operator, the revenue generated by Royal Gold, and Operator sustainability highlights. ROYAL GOLD’S REVENUE BREAKDOWN OF PRINCIPAL PROPERTIES FOR THE CALENDAR YEAR 2025 21.8% Mount Milligan $223,713,000 12.6% Pueblo Viejo $129,830,000 6.6% Cortez $67,538,000 3% Kansanshi $32,279,000 48.4% Other Properties $499,215,000 7.6% Andacollo $77,896,000 $531,256,000 $1,030,471,000 Subtotal of Principal Properties Total Revenue Principal Property Annual Stewardship Performance For the past three years, we have tracked our Principal Property Stewardship Performance using a scorecard approach. The short summaries on the following five pages allow us to consistently monitor operators' year-over-year sustainability performance. Although some parameters have evolved due to the availability of certain public disclosures, we believe the metrics reported accurately capture some of the most important sustainability- related actions companies can take to manage risks in mining. Below is our list of tracked metrics along with our corresponding definitions. Metric Definition JURISDICTION AND COMPANY REPUTATION RepRisk ESG reputational risk rating - country A metric that is a proprietary algorithm that dynamically captures and quantifies the reputational exposure to ESG risks and independently assesses the ESG reputational risk associated with a country, as defined by RepRisk. RepRisk ESG reputational risk rating - company A metric that is a proprietary algorithm that dynamically captures and quantifies the reputational exposure to ESG risks and independently assesses the ESG reputational risk associated with a company, as defined by RepRisk. Typically the assessment is done for the local operating entity. Corruption Perception Index quartile ranking An annual metric published by Transparency International that ranks countries and territories based on how corrupt their public sectors are perceived to be by experts and business executives. It utilizes a scale from 0 (highly corrupt) to 100 (very clean). WATER Water stress rating by Aqueduct™ Water Risk Atlas A measure of the ratio of total water withdrawals to available renewable surface and groundwater supplies. Water withdrawals include domestic, industrial, irrigation and livestock consumptive and non-consumptive uses. Available renewable water supplies include the impact of upstream consumptive water users and large dams on downstream water availability. Higher values indicate more competition among users. Water consumption intensity (m3/GEO) quartile ranking A measure of the water consumed per GEO produced. The quartile position is based on Skarn Associates’ water intensity curve for the gold mining industry for 2024. Water consumption intensity (m 3 /t ore processed) quartile ranking A measure of the water consumed per tonne of ore processed. The quartile position is based on Skarn Associates’ water intensity curve for the gold mining industry for 2024. SAFE OPERATION Number of fatal accidents A fatality is defined as the death of a worker from an occupational injury or disease. A fatality is recorded when death is a direct result of an occupational injury or disease. Tailing management disclosure Metric that confirms that an Operator has made publicly disclosed regarding their tailing management practices. ENERGY AND CLIMATE Corporate emission reduction target A metric that defines if an Operator has made commitment(s) to reduce total GHG emissions by 2030; these commitments may not be directly applicable to the property where we have our stream or royalty interests but refers to corporate commitments. GHG emission intensity (tCO 2 e/GEO) quartile ranking A measure of the GHG emissions intensity from an operation for each GEO produced. The quartile position is based on Skarn Associates’ GHG emissions intensity curve for the gold mining industry for 2024. Total energy intensity (GJ/GEO) quartile ranking A measure of both the direct and indirect energy consumed for each GEO produced. The quartile position is based on Skarn Associates’ energy intensity curve for the gold mining industry for 2024. BIODIVERSITY IUNC Red List species (critically endangered and endangered located in the project area) A metric that indicates the number of species classified as Critically Endangered or Endangered within a 10-km radius of the operation’s ore processing facility. Designated protected areas or KBAs covering all or part of the project area Identifies any area formally designated as a protected area by the country or international organization or the designation as covering a KBA, which is a geographical region that has been determined to be of international importance in terms of biodiversity conservation. The designation assumes a 10-km radius from the operation’s processing plant. COMMUNITY AND HUMAN RIGHTS Human Rights Policy Indicates that the company has a disclosed policy on human rights or provides enough information in other disclosures that have clear statements on human rights. Modern Slavery Disclosure Disclosure aligning with regulatory modern slavery requirements (i.e., Canadian Fighting Against Forced Labour and Child Labour in Supply Chains Act (S.C. 2023), Australian Modern Slavery Act (2018), UK Modern Slavery Act (2015), etc.). Grievance Mechanism A documented routinized process (available to all stakeholders) through which all grievances concerning business-related practices can be raised and remedy can be sought. INTRODUCTION ABOUT ROYAL GOLD GOVERNANCE OUR PEOPLE OPERATORS AND COMMUNITIES INVESTMENT STEWARDSHIP APPENDICES Royal Gold | 2025-2026 Investment Stewardship Report 12
1. Andacollo, Teck Resources COQUIMBO REGION, CHILE | 2025 REVENUE: $77,896,000 Andacollo is an open-pit mine and milling operation operated by Compañía Minera Carmen de Andacollo (“CMCA”), a 90% owned subsidiary of Teck Resources Ltd. (“Teck”); Empressa Nacional de Minería holds the remaining 10%. Gold is produced as a by-product of copper production. The mine is located in the Coquimbo Region, in the foothills of the Andes Mountains approximately two kilometers southwest of the town of Andacollo. The national grid supplies 100% renewable power to the mine through a power purchase agreement. Long-term availability of water will continue to be a priority as a new environmental permit will be required to extend the mine life. Annual Stewardship Performance JURISDICTION AND COMPANY REPUTATION - 2026 RepRisk ESG country risk rating Moderate RepRisk ESG company reputational risk rating Low Corruption Perception Index quartile ranking 1st Quartile WATER - 2024 Water stress rating by Aqueduct™ Water Risk Atlas Extremely High Water consumption intensity (m 3 /GEO) quartile ranking 1 4th Water consumption intensity (m 3 /tonne ore processed) quartile ranking 1 2nd SAFE OPERATION - 2025 Number of fatal accidents 0 Tailing management disclosure Yes ENERGY AND CLIMATE - 2024 Corporate emission reduction targets Yes GHG emissions intensity (tCO 2 e/GEO) quartile ranking 1 1st Total energy intensity (GJ/GEO) quartile ranking 1 4th BIODIVERSITY - 2026 IUCN Red List species, critically endangered and endangered (located in a 10 km radius of the project center) 17 Designated protected area or key biodiversity area (KBA) covering all or part of the project area Quisco Coquimbano COMMUNITY AND HUMAN RIGHTS - 2026 Human Rights Policy Yes Modern Slavery Disclosure Report Grievance Mechanism Yes 1. Based on Skarn Associates Gold Industry ranking curves for 2024. INTRODUCTION ABOUT ROYAL GOLD GOVERNANCE OUR PEOPLE OPERATORS AND COMMUNITIES INVESTMENT STEWARDSHIP APPENDICES Royal Gold | 2025-2026 Investment Stewardship Report 13
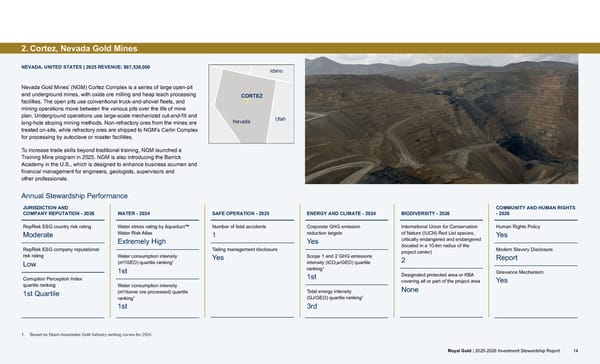
2. Cortez, Nevada Gold Mines NEVADA, UNITED STATES | 2025 REVENUE: $67,538,000 Nevada Gold Mines’ (NGM) Cortez Complex is a series of large open-pit and underground mines, with oxide ore milling and heap leach processing facilities. The open pits use conventional truck-and-shovel fleets, and mining operations move between the various pits over the life of mine plan. Underground operations use large-scale mechanized cut-and-fill and long-hole stoping mining methods. Non-refractory ores from the mines are treated on-site, while refractory ores are shipped to NGM’s Carlin Complex for processing by autoclave or roaster facilities. To increase trade skills beyond traditional training, NGM launched a Training Mine program in 2025. NGM is also introducing the Barrick Academy in the U.S., which is designed to enhance business acumen and financial management for engineers, geologists, supervisors and other professionals. Annual Stewardship Performance JURISDICTION AND COMPANY REPUTATION - 2026 RepRisk ESG country risk rating Moderate RepRisk ESG company reputational risk rating Low Corruption Perception Index quartile ranking 1st Quartile WATER - 2024 Water stress rating by Aqueduct™ Water Risk Atlas Extremely High Water consumption intensity (m 3 /GEO) quartile ranking 1 1st Water consumption intensity (m 3 /tonne ore processed) quartile ranking 1 1st SAFE OPERATION - 2025 Number of fatal accidents 1 Tailing management disclosure Yes ENERGY AND CLIMATE - 2024 Corporate GHG emission reduction targets Yes Scope 1 and 2 GHG emissions intensity (tCO 2 e/GEO) quartile ranking 1 1st Total energy intensity (GJ/GEO) quartile ranking 1 3rd BIODIVERSITY - 2026 International Union for Conservation of Nature (IUCN) Red List species, critically endangered and endangered (located in a 10-km radius of the project center) 2 Designated protected area or KBA covering all or part of the project area None COMMUNITY AND HUMAN RIGHTS - 2026 Human Rights Policy Yes Modern Slavery Disclosure Report Grievance Mechanism Yes 1. Based on Skarn Associates Gold Industry ranking curves for 2024. INTRODUCTION ABOUT ROYAL GOLD GOVERNANCE OUR PEOPLE OPERATORS AND COMMUNITIES INVESTMENT STEWARDSHIP APPENDICES Royal Gold | 2025-2026 Investment Stewardship Report 14
This is a modal window.
3. Mount Milligan, Centerra Gold BRITISH COLUMBIA, CANADA | 2025 REVENUE: $223,713,000 Mount Milligan is a large-scale, open-pit copper and gold mine operated by Centerra Gold Inc. (“Centerra”). The mine is located within the Omenica Mining Division in north-central British Columbia, Canada. Construction of the Mount Milligan mine began in June 2010, with commissioning of the mine beginning in August 2013 and the achievement of commercial production in February 2014. The mining operation uses a conventional truck-and-shovel fleet, with ore processed through a 60,000-tonne per day flotation processing plant, to produce a concentrate containing copper, gold and silver. The concentrate is trucked to the rail loadout facility in Mackenzie and railed to North Vancouver, where it is loaded onto ships and sent to purchasers located around the Pacific Rim. Mount Milligan received an amended environmental assessment and all related permits to allow for the continuation of operations through 2035. Annual Stewardship Performance JURISDICTION AND COMPANY REPUTATION - 2026 RepRisk ESG country risk rating Low RepRisk ESG company reputational risk rating Low Corruption Perception Index quartile ranking 1st Quartile WATER - 2024 Water stress rating by Aqueduct™ Water Risk Atlas Low Water consumption intensity (m 3 /GEO) quartile ranking 1 4th Water consumption intensity (m 3 /tonne ore processed) quartile ranking 1 1st SAFE OPERATION - 2025 Number of fatal accidents 0 Tailing management disclosure Yes ENERGY AND CLIMATE - 2024 Corporate emission reduction targets No GHG emissions intensity (tCO 2 e/GEO) quartile ranking 1 1st Total energy intensity (GJ/GEO) quartile ranking 1 4th BIODIVERSITY - 2026 IUCN Red List species, critically endangered and endangered (located in a 10 km radius of the project center) 1 Designated protected area or KBA covering all or part of the project area None COMMUNITY AND HUMAN RIGHTS - 2026 Human Rights Policy Yes Modern Slavery Disclosure Report Grievance Mechanism Yes 1. Based on Skarn Associates Gold Industry ranking curves for 2024. INTRODUCTION ABOUT ROYAL GOLD GOVERNANCE OUR PEOPLE OPERATORS AND COMMUNITIES INVESTMENT STEWARDSHIP APPENDICES Royal Gold | 2025-2026 Investment Stewardship Report 15
4. Pueblo Viejo, Barrick Gold SÁNCHEZ RAMÍREZ, DOMINICAN REPUBLIC | 2025 REVENUE: $129,830,000 Pueblo Viejo is an open-pit gold mine owned by a joint venture in which Barrick Mining Corporation holds a 60% interest (and is the operator) and Newmont Corporation holds the remaining 40% interest. The mine is located in the central part of the Dominican Republic in the province of Sánchez Ramírez. The construction of a new tailings storage facility is planned as part of an effort to extend the mine life. As part of this undertaking, a Resettlement Action Plan was prepared in alignment with international standards. The mine is committed to continuing dialogue and reaching agreements with the impacted communities. The development of the New Horizons residential community near the mine continues to progress. Approximately 310 of 633 households were resettled to the new community during 2025. The establishment of the new community will allow for the development of a new tailings storage facility which aims to extend the mine life. Annual Stewardship Assessment JURISDICTION AND COMPANY REPUTATION - 2026 RepRisk ESG country risk rating High RepRisk ESG company reputational risk rating High Corruption Perception Index quartile ranking 3rd Quartile WATER - 2024 Water stress rating by Aqueduct™ Water Risk Atlas Low-Medium Water consumption intensity (m 3 /GEO) quartile ranking 1 4th Water consumption intensity (m 3 /tonne ore processed) quartile ranking 1 4th SAFE OPERATION - 2025 Number of fatal accidents 0 Tailing management disclosure Yes ENERGY AND CLIMATE - 2024 Corporate emission reduction targets Yes GHG emissions intensity (tCO 2 e/GEO) quartile ranking 1 4th Total energy intensity (GJ/GEO) quartile ranking 1 4th BIODIVERSITY - 2026 IUCN Red List species, critically endangered and endangered (located in a 10-km radius of the project center) 33 Designated protected area or KBA covering all or part of the project area Aniana Vargas National Park COMMUNITY AND HUMAN RIGHTS - 2026 Human Rights Policy Yes Modern Slavery Disclosure Report Grievance Mechanism Yes 1. Based on Skarn Associates Gold Industry ranking curves for 2024. INTRODUCTION ABOUT ROYAL GOLD GOVERNANCE OUR PEOPLE OPERATORS AND COMMUNITIES INVESTMENT STEWARDSHIP APPENDICES Royal Gold | 2025-2026 Investment Stewardship Report 16
5. Kansanshi, First Quantum Minerals NORTH-WESTERN PROVINCE, ZAMBIA | 2025 REVENUE: $129,830,000 Kansanshi is an open-pit mine owned and operated by Kansanshi Mining PLC, which is 80% owned indirectly by First Quantum Minerals Ltd. (“First Quantum”) and 20% by ZCCM Investments Holdings PLC, a listed company that is majority owned by the Government of the Republic of Zambia. The mine is located adjacent to the town of Solwezi, the capital of the Zambian North-Western Province. On August 5, 2025, RGLD Gold entered into a precious metals purchase agreement for gold deliveries referenced to copper production from the Kansanshi copper-gold mine. Royal Gold included a community contribution to support of the mine's sustainability efforts of $7 per gold ounce delivered in our 2025 stream agreement for the mine. Annual Stewardship Assessment JURISDICTION AND COMPANY REPUTATION - 2026 RepRisk ESG country risk rating Moderate RepRisk ESG company reputational risk rating Very High Corruption Perception Index quartile ranking 3rd Quartile WATER - 2024 2 Water stress rating by Aqueduct™ Water Risk Atlas N/A Water consumption intensity (m 3 /GEO) quartile ranking 1 N/A Water consumption intensity (m 3 /tonne ore processed) quartile ranking 1 N/A SAFE OPERATION - 2025 Number of fatal accidents 0 Tailing management disclosure Yes ENERGY AND CLIMATE - 2024 2 Corporate emission reduction targets N/A GHG emissions intensity (tCO 2 e/GEO) quartile ranking 1 N/A Total energy intensity (GJ/GEO) quartile ranking 1 N/A BIODIVERSITY - 2026 IUCN Red List species, critically endangered and endangered (located in a 10-km radius of the project center) 21 Designated protected area or KBA covering all or part of the project area None COMMUNITY AND HUMAN RIGHTS - 2026 Human Rights Policy Yes Modern Slavery Disclosure Report Grievance Mechanism Yes 1. Based on Skarn Associates Gold Industry ranking curves for 2024 2. An “N/A” indicates that 2024 data associated with Kansanshi is not reported as the asset was not part of the Royal Gold portfolio. We expect to fully report detailed data for Kansanshi in next year’s report. INTRODUCTION ABOUT ROYAL GOLD GOVERNANCE OUR PEOPLE OPERATORS AND COMMUNITIES INVESTMENT STEWARDSHIP APPENDICES Royal Gold | 2025-2026 Investment Stewardship Report 17
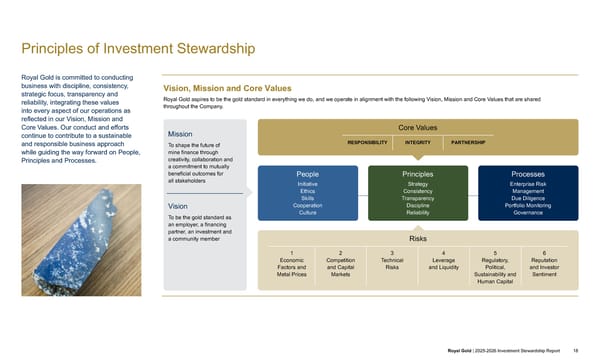
Principles of Investment Stewardship Royal Gold is committed to conducting business with discipline, consistency, strategic focus, transparency and reliability, integrating these values into every aspect of our operations as reflected in our Vision, Mission and Core Values. Our conduct and efforts continue to contribute to a sustainable and responsible business approach while guiding the way forward on People, Principles and Processes. Vision, Mission and Core Values Royal Gold aspires to be the gold standard in everything we do, and we operate in alignment with the following Vision, Mission and Core Values that are shared throughout the Company. Mission To shape the future of mine finance through creativity, collaboration and a commitment to mutually beneficial outcomes for all stakeholders Vision To be the gold standard as an employer, a financing partner, an investment and a community member Core Values RESPONSIBILITY INTEGRITY PARTNERSHIP People Initiative Ethics Skills Cooperation Culture Principles Strategy Consistency Transparency Discipline Reliability Processes Enterprise Risk Management Due Diligence Portfolio Monitoring Governance Risks 1 Economic Factors and Metal Prices 2 Competition and Capital Markets 3 Technical Risks 4 Leverage and Liquidity 5 Regulatory, Political, Sustainability and Human Capital 6 Reputation and Investor Sentiment INTRODUCTION ABOUT ROYAL GOLD GOVERNANCE OUR PEOPLE OPERATORS AND COMMUNITIES INVESTMENT STEWARDSHIP APPENDICES Royal Gold | 2025-2026 Investment Stewardship Report 18
Our People, Principles and Processes Managing our business and reporting progress on our People, Principles and Processes provides an effective and concise way for our stakeholders to evaluate Royal Gold’s performance. 19 Royal Gold | 2025-2026 Investment Stewardship Report People The ability to effectively deliver on our core values depends on our team. We seek to assemble, develop and retain a team with distinct experiences and talents that contribute to the success of our Company. We believe the following qualities are necessary for success. Skills: We seek team members who have skills in our specific areas of focus, such as finance, business development, technical, legal and accounting. Cooperation: Our transactions often touch all areas of our Company, and we believe coordination and cooperation are essential to our success. All of our employees understand that with a small team, everyone must work together to reach our common goals. Culture: We operate in an inclusive, challenging and enjoyable work environment. Each individual contributes unique skills and abilities toward our success. Initiative: Our team members proactively aspire to create new business opportunities and address the Company’s challenges. Ethics: We expect our team to act with integrity and humility with fellow employees, the Operators, our investors and other stakeholders. Principles We conduct our business according to a set of operating principles that we believe are characteristics of a successful organization. Discipline: We attempt to manage all aspects of the business using the same rigor across the organization. This includes reviewing new business opportunities, monitoring our portfolio and applying appropriate accounting and tax practices. Consistency: Through our messaging and our direct interaction with stakeholders, we seek to present an approach that does not vary based on the trends at the time. Strategy: We aim to maintain our strategy of seeking high-quality precious metal assets in safe jurisdictions with experienced Operators. Transparency: We are committed to maintaining transparent communications with our stakeholders. Reliability: We want our stakeholders to be comfortable with our approach to the management of our key risks and to be able to rely on our team as stewards of capital. Processes Our processes are designed to manage risk and are largely grouped around our Board and committee responsibilities, our legal and regulatory compliance, our due diligence reviews for new investments, the monitoring of our portfolio of properties, and accounting and financial controls. A summary of how we manage some of these important risk processes is provided on the following pages. Enterprise Risk Management (ERM): We strive to ensure that management regularly reviews the various risks associated with the Company’s interest and business, which includes an assessment of the size, direction and severity of various risks. Due Diligence: We seek to review all aspects of operations in which we contemplate an investment, including risk areas that range from geology to permitting to the social license of projects and the sponsoring companies along with general jurisdictional risks. Portfolio Monitoring: We actively monitor our stream and royalty interests to understand evolving legal, technical and financial aspects of the companies and projects, including their economic and operational health and their reputations in the jurisdictions and nearby communities where they operate. Board and Committee Effectiveness: Our highly capable and independent Board consists of individuals with diverse skills and experience that align with our business strategy, and our committee members are all qualified to assess the risk areas assigned to our Audit and Finance Committee and Compensation, Nominating and Governance (CNG) Committee. INTRODUCTION ABOUT ROYAL GOLD GOVERNANCE OUR PEOPLE OPERATORS AND COMMUNITIES INVESTMENT STEWARDSHIP APPENDICES
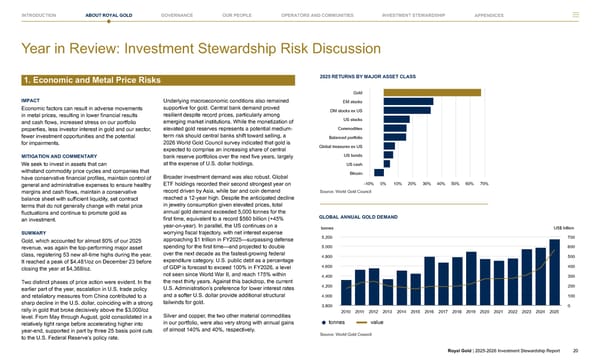
Year in Review: Investment Stewardship Risk Discussion Royal Gold | 2025-2026 Investment Stewardship Report 20 1. Economic and Metal Price Risks IMPACT Economic factors can result in adverse movements in metal prices, resulting in lower financial results and cash flows, increased stress on our portfolio properties, less investor interest in gold and our sector, fewer investment opportunities and the potential for impairments. MITIGATION AND COMMENTARY We seek to invest in assets that can withstand commodity price cycles and companies that have conservative financial profiles, maintain control of general and administrative expenses to ensure healthy margins and cash flows, maintain a conservative balance sheet with sufficient liquidity, set contract terms that do not generally change with metal price fluctuations and continue to promote gold as an investment. SUMMARY Gold, which accounted for almost 80% of our 2025 revenue, was again the top-performing major asset class, registering 53 new all-time highs during the year. It reached a peak of $4,481/oz on December 23 before closing the year at $4,368/oz. Two distinct phases of price action were evident. In the earlier part of the year, escalation in U.S. trade policy and retaliatory measures from China contributed to a sharp decline in the U.S. dollar, coinciding with a strong rally in gold that broke decisively above the $3,000/oz level. From May through August, gold consolidated in a relatively tight range before accelerating higher into year-end, supported in part by three 25 basis point cuts to the U.S. Federal Reserve’s policy rate. Underlying macroeconomic conditions also remained supportive for gold. Central bank demand proved resilient despite record prices, particularly among emerging market institutions. While the monetization of elevated gold reserves represents a potential medium- term risk should central banks shift toward selling, a 2026 World Gold Council survey indicated that gold is expected to comprise an increasing share of central bank reserve portfolios over the next five years, largely at the expense of U.S. dollar holdings. Broader investment demand was also robust. Global ETF holdings recorded their second strongest year on record driven by Asia, while bar and coin demand reached a 12-year high. Despite the anticipated decline in jewelry consumption given elevated prices, total annual gold demand exceeded 5,000 tonnes for the first time, equivalent to a record $560 billion (+45% year-on-year). In parallel, the US continues on a worrying fiscal trajectory, with net interest expense approaching $1 trillion in FY2025—surpassing defense spending for the first time—and projected to double over the next decade as the fastest-growing federal expenditure category. U.S. public debt as a percentage of GDP is forecast to exceed 100% in FY2026, a level not seen since World War II, and reach 175% within the next thirty years. Against this backdrop, the current U.S. Administration’s preference for lower interest rates and a softer U.S. dollar provide additional structural tailwinds for gold. Silver and copper, the two other material commodities in our portfolio, were also very strong with annual gains of almost 140% and 40%, respectively. INTRODUCTION ABOUT ROYAL GOLD GOVERNANCE OUR PEOPLE OPERATORS AND COMMUNITIES INVESTMENT STEWARDSHIP APPENDICES 2025 RETURNS BY MAJOR ASSET CLASS -10% 0% 10% 20% 30% 40% 50% 60% 70% Gold EM stocks DM stocks ex US US stocks Commodities Balanced portfolio Global treasures ex US US bonds US cash Bitcoin Source: World Gold Council GLOBAL ANNUAL GOLD DEMAND 2010 2011 2012 2013 2014 2015 2016 2017 2018 2019 2020 2021 2022 2023 2024 2025 3,800 4,000 4,200 4,400 4,600 4,800 5,000 5,200 0 100 200 300 400 500 600 700 US$ billion tonnes 🟇 tonnes value Source: World Gold Council
ANNUAL CHANGE IN GOLD-BACKED ETFs BY REGION 🟇 North America 🟇 Europe 🟇 Asia 🟇 Other Total AUM Data as of 31 December 2025. Source: World Gold Council 2004 2007 2010 2013 2016 2019 2022 2025 -1,000 -500 0 500 1,000 0 150 300 450 600 Tonnes $ billion FORECAST UNITED STATES FEDERAL DEBT HELD BY THE PUBLIC (% OF GDP) Source: Congressional Budget Office 1940 1950 1960 1970 1980 1990 2000 2010 2020 2030 2040 2050 0% 20% 40% 60% 80% 100% 120% 140% 160% 180% 200% ANNUAL AND CUMULATIVE NET GOLD DEMAND FROM CENTRAL BANKS (TONNES) 🟇 Central bank net purchases Cumulative total Data as of December 31, 2025. Source: World Gold Council 2010 2011 2012 2013 2014 2015 2016 2017 2018 2019 2020 2021 2022 2023 2024 2025 0 400 800 1,200 0 2,000 4,000 6,000 8,000 10,000 12,000 US DEBT HELD BY CENTRAL BANKS (% OF TOTAL DEBT) CENTRAL BANK GOLD HOLDINGS (% OF CURRENCY RESERVES) CB Gold Holdings (lhs) US Debt Held by Foreign Central Banks (rhs) Source: Crescat Capital, Federal Reserve St. Louis, World Gold Council, Incrementum AG INTRODUCTION ABOUT ROYAL GOLD GOVERNANCE OUR PEOPLE OPERATORS AND COMMUNITIES INVESTMENT STEWARDSHIP APPENDICES Royal Gold | 2025-2026 Investment Stewardship Report 21
2. Competition and Capital Markets IMPACT Increased competition for new business opportunities from debt providers, the capital markets, private equity and other royalty and streaming companies can result in fewer investment opportunities and lower returns and can impact our ability to meet strategic growth goals. MITIGATION AND COMMENTARY We seek to maintain flexibility in the structuring of transactions to address the unique needs of each potential counterparty, identify opportunities with excellent upside that warrant a focus on longer-term returns and stress the advantages of stream and royalty financing relative to other sources of capital. SUMMARY 2025 was a record year for streaming and royalty transactions, as well as corporate M&A activity, with total deal value approaching $10 billion—more than double the previous annual record. Royal Gold accounted for approximately 50% of this value, highlighted by the largest corporate transaction in the sector’s history involving our acquisition of Sandstorm Gold and Horizon Copper, as well as the largest single stream or royalty acquisition in our history at the Kansanshi mine. Our single-asset transactions were characterized by creative structuring solutions that demonstrated both the flexibility and the increasing attractiveness of streaming and royalty financing relative to other sources of capital. Higher gold and silver prices, combined with growing investor interest in the sector, supported a material increase in equity issuance by mining companies compared to recent years. The majority of these equity financings were directed toward advancing earlier-stage development projects, with approximately two-thirds of announced transactions valued at less than $50 million. Debt issuance by mining companies remained robust among diversified and bulk commodity companies but was comparatively subdued within the precious metals sector, potentially reflecting the continued emergence of streaming as a credible and increasingly accepted alternative to debt. 2020 2021 2022 2023 2024 2025 $0 $2,000 $4,000 $6,000 $8,000 $10,000 $12,000 $14,000 MINING EQUITY ISSUANCE (US$ MILLION) 🟇 Precious 🟇 Base 🟇 Diversified, Bulk & Other MINING DEBT ISSUANCE (US$ MILLION) $25,000 $20,000 $15,000 $10,000 $5,000 $0 2020 2021 2022 2023 2024 2025 🟇 Precious 🟇 Base 🟇 Diversified, Bulk & Other 2010 2011 2012 2013 2014 2015 2016 2017 2018 2019 2020 2021 2022 2023 2024 2025 0.0 1.0 2.0 3.0 4.0 5.0 6.0 7.0 8.0 9.0 10.0 🟇 Stream and Royalty 🟇 Corporate TRANSACTION DEAL VALUE (US$ BILLION) Source: National Bank Financial Stream and Royalty Sector Update, December 2025 INTRODUCTION ABOUT ROYAL GOLD GOVERNANCE OUR PEOPLE OPERATORS AND COMMUNITIES INVESTMENT STEWARDSHIP APPENDICES Royal Gold | 2025-2026 Investment Stewardship Report 22
3. Technical Risks IMPACT The technical risks associated with developing and/or operating the mining operations in which we invest can have an impact on our near-term and long-term cash flows and may result in impairments and/or a loss of reputation regarding our ability to conduct due diligence. MITIGATION AND COMMENTARY We seek to mitigate these risks with an experienced in- house technical team and through the maintenance of a diversified portfolio of revenue-producing properties, completion of technical due diligence prior to an investment and active monitoring of our portfolio. SUMMARY As part of our ongoing diligence and portfolio monitoring efforts, we conducted 10 site visits to our properties during 2025. A key risk in the portfolio that we continue to monitor is the low silver recovery at Pueblo Viejo, driven by a lime supply constraint. A significant portion of silver is recovered by dissolving jarosite in a lime boil step following pressure oxidation and upstream of the CIL circuit, but this process has been limited by lime availability. The high proportion of stockpile material currently being processed generates elevated acid loads, and most of the site's lime production is being diverted to circuit neutralization rather than silver liberation. We expect silver recoveries to remain below threshold levels for an extended period until Barrick Gold completes construction of an additional lime kiln. We achieved record financial results in 2025, generating $1.0 billion in revenue, an approximate 40% increase over 2024. Our portfolio expanded significantly through both corporate and single-asset transactions. By year-end, we held interests in 81 producing assets—double the number held at the end of 2024—as well as 29 development assets and more than 250 additional assets at various stages of evaluation. Royal Gold now has the most diversified portfolio in the industry, with no single asset representing more than approximately 15% of total portfolio net asset value. During the year, we also received full repayment of advance stream deposits related to the Rainy River, Pueblo Viejo, and Andacollo mines. Going forward, we will only pay the contracted percentage of the spot price for any metal delivered from these properties. We were encouraged by several positive developments across our Principal Properties including a mine life extension at Mount Milligan, the release of a preliminary PEA for Barrick Gold’s Fourmile project within the Cortez complex, approval of the Khoemacau expansion project, and the achievement of commercial production at the Kansanshi S3 expansion project. 1. Based on consensus NAV as of March 12, 2026. INTRODUCTION ABOUT ROYAL GOLD GOVERNANCE OUR PEOPLE OPERATORS AND COMMUNITIES INVESTMENT STEWARDSHIP APPENDICES Royal Gold | 2025-2026 Investment Stewardship Report 23 🟇 Mt. Milligan 🟇 Pueblo Viejo 🟇 Kansanshi 🟇 Cortez 🟇 Andacollo 🟇 Khoemacau 🟇 Platreef 🟇 Hod Maden 🟇 Antamina 🟇 MARA NAV BY ASSET 1 70% Top 10 Assets 🟇 Centerra Gold Inc. 🟇 Barrick 🟇 Teck Resources 🟇 First Quantum 🟇 Nevada Gold Mines 🟇 MMG Limited 🟇 Glencore 🟇 Other NAV BY COUNTERPARTY 1
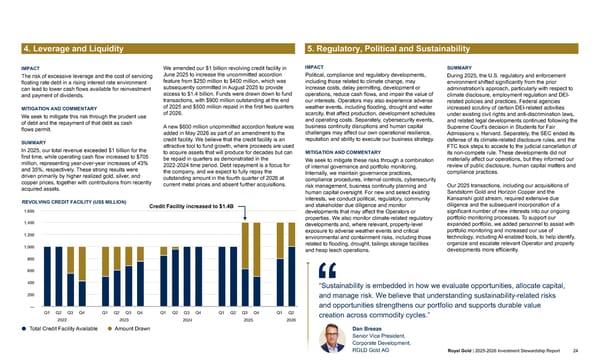
4. Leverage and Liquidity IMPACT The risk of excessive leverage and the cost of servicing floating rate debt in a rising interest rate environment can lead to lower cash flows available for reinvestment and payment of dividends. MITIGATION AND COMMENTARY We seek to mitigate this risk through the prudent use of debt and the repayment of that debt as cash flows permit. SUMMARY In 2025, our total revenue exceeded $1 billion for the first time, while operating cash flow increased to $705 million, representing year-over-year increases of 43% and 35%, respectively. These strong results were driven primarily by higher realized gold, silver, and copper prices, together with contributions from recently acquired assets. We amended our $1 billion revolving credit facility in June 2025 to increase the uncommitted accordion feature from $250 million to $400 million, which was subsequently committed in August 2025 to provide access to $1.4 billion. Funds were drawn down to fund transactions, with $900 million outstanding at the end of 2025 and $500 million repaid in the first two quarters of 2026. A new $600 million uncommitted accordion feature was added in May 2026 as part of an amendment to the credit facility. We believe that the credit facility is an attractive tool to fund growth, where proceeds are used to acquire assets that will produce for decades but can be repaid in quarters as demonstrated in the 2022-2024 time period. Debt repayment is a focus for the company, and we expect to fully repay the outstanding amount in the fourth quarter of 2026 at current metal prices and absent further acquisitions. Q1 Q2 Q3 Q4 Q1 Q2 Q3 Q4 Q1 Q2 Q3 Q4 Q1 Q2 Q3 Q4 Q1 Q2 — 200 400 600 800 1,000 1,200 1,400 1,600 🟇 Total Credit Facility Available 🟇 Amount Drawn REVOLVING CREDIT FACILITY (US$ MILLION) 2022 2023 2024 2025 2026 Credit Facility increased to $1.4B IMPACT 5. Regulatory, Political and Sustainability IMPACT Political, compliance and regulatory developments, including those related to climate change, may increase costs, delay permitting, development or operations, reduce cash flows, and impair the value of our interests. Operators may also experience adverse weather events, including flooding, drought and water scarcity, that affect production, development schedules and operating costs. Separately, cybersecurity events, business continuity disruptions and human capital challenges may affect our own operational resilience, reputation and ability to execute our business strategy. MITIGATION AND COMMENTARY We seek to mitigate these risks through a combination of internal governance and portfolio monitoring. Internally, we maintain governance practices, compliance procedures, internal controls, cybersecurity risk management, business continuity planning and human capital oversight. For new and select existing interests, we conduct political, regulatory, community and stakeholder due diligence and monitor developments that may affect the Operators or properties. We also monitor climate-related regulatory developments and, where relevant, property-level exposure to adverse weather events and critical environmental and containment risks, including those related to flooding, drought, tailings storage facilities and heap leach operations. SUMMARY During 2025, the U.S. regulatory and enforcement environment shifted significantly from the prior administration’s approach, particularly with respect to climate disclosure, employment regulation and DEI- related policies and practices. Federal agencies increased scrutiny of certain DEI-related activities under existing civil rights and anti-discrimination laws, and related legal developments continued following the Supreme Court’s decision in Students for Fair Admissions v. Harvard. Separately, the SEC ended its defense of its climate-related disclosure rules, and the FTC took steps to accede to the judicial cancellation of its non-compete rule. These developments did not materially affect our operations, but they informed our review of public disclosure, human capital matters and compliance practices. Our 2025 transactions, including our acquisitions of Sandstorm Gold and Horizon Copper and the Kansanshi gold stream, required extensive due diligence and the subsequent incorporation of a significant number of new interests into our ongoing portfolio monitoring processes. To support our expanded portfolio, we added personnel to assist with portfolio monitoring and increased our use of technology, including AI-enabled tools, to help identify, organize and escalate relevant Operator and property developments more efficiently. INTRODUCTION ABOUT ROYAL GOLD GOVERNANCE OUR PEOPLE OPERATORS AND COMMUNITIES INVESTMENT STEWARDSHIP APPENDICES Royal Gold | 2025-2026 Investment Stewardship Report 24 “Sustainability is embedded in how we evaluate opportunities, allocate capital, and manage risk. We believe that understanding sustainability-related risks and opportunities strengthens our portfolio and supports durable value creation across commodity cycles.” Dan Breeze Senior Vice President, Corporate Development, RGLD Gold AG
6. Reputation and Investor Sentiment IMPACT The risk associated with decreasing investor interest in gold and a loss of confidence in management’s ability to properly manage risk and effectively communicate with the market and our shareholders. MITIGATION AND COMMENTARY We seek to mitigate these risks through strong governance and transparent disclosure practices, frequent interaction with our shareholders and, where appropriate, by addressing concerns and recommendations. SUMMARY Royal Gold grew significantly in 2025 through $5.4 billion of acquisitions, creating a materially larger and more diversified portfolio. This transformation supported a year-end share price of $222.29 and a market capitalization of $18.9 billion, representing year-over-year increases of approximately 70% and 120%, respectively. We believe our enhanced scale, industry-leading diversification, and improved trading liquidity strengthen Royal Gold’s position within the sector and address prior investor concerns regarding the Company’s relative size and market relevance. In March 2026, we introduced a 5-year outlook for total GEOs to provide transparency for our long-term revenue potential. To support this growth, we expanded human capital within key functions including finance, accounting, investor relations, legal, operations, and technology. Our continued strong cash flow supported a 6% increase in the annual dividend to $1.90 per share for 2026, marking the 25th consecutive annual increase. Since inception, Royal Gold has paid approximately $1.2 billion in cumulative dividends, representing a compound annual growth rate of approximately 15%. Royal Gold remains unique within the sector as the only precious metals company included in the S&P High Yield Dividend Aristocrats Index, alongside other high-quality companies such as Lowe’s, Caterpillar, and Walmart. Our inclusion across more than 250 global indices further reflects the breadth of our shareholder base and market presence. Our cash G&A remained low and stable at approximately 4% of revenue. At the annual shareholders’ meeting in May 2025, independent Directors Mr. Bill Hayes, Chair, and Mr. Ron Vance, were re-elected. Additionally, Mark Isto, formerly Executive Vice President and Chief Operating Officer for Royal Gold, was appointed to the Board as a non-independent Director. Mr. Isto brings more than 40 years of global experience in mining engineering, mine management, and project development. After serving as a Director since 2014, Mr. Kevin McArthur resigned from the Board at the annual shareholders’ meeting in May 2025 to assume a new role requiring significant commitments of his time and attention. Mr. McArthur’s technical experience will be filled by that provided by Mr. Isto. Independent Directors Ms. Fabiana Chubbs and Ms. Sybil Veenman were re-elected at the May 2026 annual shareholder’s meeting. Investor engagements focused on key areas including rising political risk, competitive transaction pricing, and the restructuring of key interests within the Sandstorm Gold and Horizon Copper portfolios. Shortly after closing these transactions, we began rationalizing the combined portfolio through the sale of our approximate 25% equity interest in Versamet Royalties, followed by the restructuring of certain equity and debt interests in Bear Creek Mining in late 2025. Our non-operating JV interest at the Hod Maden project was a particular focus for investors after we acquired the portfolio. We were pleased to restructure this interest in Q2/2026, which included receiving a new NSR royalty over the project and certain rights pertaining to a new royalty granted to another JV partner as part of the sale of their interest in the project. INTRODUCTION ABOUT ROYAL GOLD GOVERNANCE OUR PEOPLE OPERATORS AND COMMUNITIES INVESTMENT STEWARDSHIP APPENDICES Royal Gold | 2025-2026 Investment Stewardship Report 25 DIVIDEND HISTORY 2000 2001 2002 2003 2004 2005 2006 2007 2008 2009 2010 2011 2012 2013 2014 2015 2016 2017 2018 2019 2020 2021 2022 2023 2024 2025 2026 $0.00 $0.20 $0.40 $0.60 $0.80 $1.00 $1.20 $1.40 $1.60 $1.80 $2.00 $0 $400 $800 $1,200 $1,600 $2,000 $2,400 $2,800 $3,200 $3,600 $4,000 $4,400 $4,800 Dividend (US$/share) Gold Price (US$/ounce) 17% 19% 14% 18% 20% 31% 21% 24% 21% 34% 22% 15% 23% 29% 34% 35% 25% 22% 23% 23% 19% 17% 22% 24% 20% 17% Dividend Payout Ratio Gold Price Source: Company records
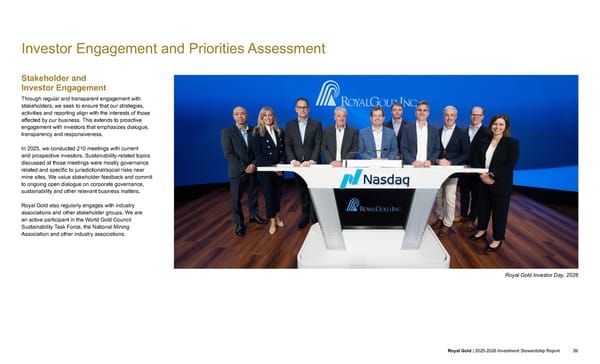
Investor Engagement and Priorities Assessment Stakeholder and Investor Engagement Through regular and transparent engagement with stakeholders, we seek to ensure that our strategies, activities and reporting align with the interests of those affected by our business. This extends to proactive engagement with investors that emphasizes dialogue, transparency and responsiveness. In 2025, we conducted 210 meetings with current and prospective investors. Sustainability-related topics discussed at those meetings were mostly governance related and specific to jurisdictional/social risks near mine sites. We value stakeholder feedback and commit to ongoing open dialogue on corporate governance, sustainability and other relevant business matters. Royal Gold also regularly engages with industry associations and other stakeholder groups. We are an active participant in the World Gold Council Sustainability Task Force, the National Mining Association and other industry associations. Royal Gold Investor Day, 2026 INTRODUCTION ABOUT ROYAL GOLD GOVERNANCE OUR PEOPLE OPERATORS AND COMMUNITIES INVESTMENT STEWARDSHIP APPENDICES Royal Gold | 2025-2026 Investment Stewardship Report 26
Investment Stewardship Priorities Assessment Stakeholders expect information not only on how risks may financially affect a company but also how a company’s actions may impact the environment and society. Our priorities assessment takes into account perspectives from our investors, our Board and our employees. The two charts below highlight our priorities from two perspectives: consolidated risks identified in our portfolio and our corporate employees. CONSOLIDATED RISKS IDENTIFIED IN OUR PORTFOLIO Biodiversity and Land Use GHG Emissions Talent Attraction and Retention Human Rights and Indigenous People Rights Community Investments and Relations Water Management Climate Change Tailings and Waste Management Health, Safety and Wellness Ethics, Integrity and Compliance Risk Management Sociopolitical OUR CORPORATE EMPLOYEES 🟇 Environmental 🟇 Social 🟇 Governance Climate Change Community Investments and Relations Diversity and Inclusion ESG Integration in Decision-Making Cybersecurity Health, Safety and Wellness Risk Management Talent Attraction and Retention Ethics, Integrity and Compliance Approach Topics and the assessment process for this undertaking were cross-referenced with the Sustainability Accounting Standards Board (SASB) for the industries of “Asset Management & Custody Activities” and “Metals & Mining”, the Corporate Sustainability Reporting Directive (CSRD), peer and mining operator disclosures, and our existing investment stewardship priorities. We have disclosed what we believe are our most important investment stewardship topics relating to our mining operator interests (indirect topics) and our corporate offices (direct topics). Indirect topics include risks at the mine site level that are managed by Operators but nevertheless represent indirect risks or opportunities for Royal Gold. Direct topics include risks at Royal Gold corporate offices that affect its 39 employees. The assessment of responses included both a qualitative and quantitative review of inputs. This approach resulted in two graphs that reflect the impact on society and environment along with the impact on our financial performance by reference to risks impacting our Operators and our own corporate operations. The Investment Stewardship Priorities Assessment is updated periodically. We plan to complete a full review of our Priorities Assessment in 2026. INVESTMENT STEWARDSHIP PRIORITY ASSESSMENT PROCESS Identify sustainability topics. Interview Board and select investors and survey employees. Analyze outcomes (risk and opportunity assessment). Finalize and update Investment Stewardship Priority Matrix with CEO and executive management guidance. Develop strategic action plan to monitor priority topics. Disclose progress made on action plan. INTRODUCTION ABOUT ROYAL GOLD GOVERNANCE OUR PEOPLE OPERATORS AND COMMUNITIES INVESTMENT STEWARDSHIP APPENDICES Royal Gold | 2025-2026 Investment Stewardship Report 27
PROGRESS ON OUR 2024 PLANS The table below highlights our progress on the 2025 priorities disclosed in our 2024 Investment Stewardship Report. 2024 Plans 2025 Progress Achievements Environment and climate change • Achieve carbon neutrality for corporate emissions annually. • Improved Forest Management Carbon-Removal credits were secured to offset our 2024 scope 2 and 3 corporate emissions. • • Evaluate opportunities to make a positive impact and reduce risk for our interests with respect to climate change. • We will continue to evaluate and better understand the risk associated with climate change for our interests; however, no specific opportunities were pursued in 2025. • • Engage with the Operators that provide more than 2% of our revenue and work to understand what actions they are specifically taking to reduce GHG emissions; where appropriate, determine if we can be a source of financing to advance selected initiatives. • We continue to make an effort to engage with the Operators, when appropriate, on opportunities relating to GHG emissions. • Community investment • Aim to contribute $1.5 million in support to organizations that serve the needs of the communities in which our corporate offices and Operators are located, continuing to align with the SDGs. • In 2025, Royal Gold contributed a total of $1.56 million to 31 organizations globally, all of which align with the SDGs. • • Continue to strengthen our scholarship and mining education contributions by establishing two new scholarships. • In 2025, one new scholarship with the University of British Columbia was added to the Royal Gold scholarship portfolio. • Investment Stewardship Governance • Complete sustainability-focused educational opportunities for employees. • We provided cybersecurity training to all employees in 2025. • • Evaluate the potential expansion of our alignment with internationally recognized sustainability-related standards. • We deferred this target due to the significant time spent on the Sandstorm Gold and Horizon Copper transaction in 2025. 2026 PRIORITIES INVESTMENT STEWARDSHIP GOVERNANCE We will continue to evaluate meaningful ways to make improvements across our business. The bullets below outline Royal Gold’s investment stewardship priorities for 2026. • Conduct human rights training for employees. • Update our tailings assessment to include new properties. • Prepare to disclose our next Climate Report in 2027. • Complete a full review of our Investment Stewardship Priorities Assessment in 2026. • Establish one new mining-focused scholarship with a new university. • Evaluate the potential expansion of our alignment with internationally recognized sustainability-related standards. ENVIRONMENT • We will continue to engage with Operators to understand what actions they are specifically taking to reduce GHG emissions; where appropriate, we will determine if we can be a source of financing to advance selected initiatives. • We will continue to maintain carbon neutrality for our corporate emissions through the purchase of high-quality, verified carbon offsets and implement reduction strategies for our corporate operations where we can. COMMUNITY INVESTMENT • We aim to contribute $1.5 million in support to organizations that serve the needs of the communities in which our corporate offices and Operators are located, continuing to align with the SDGs. INTRODUCTION ABOUT ROYAL GOLD GOVERNANCE OUR PEOPLE OPERATORS AND COMMUNITIES INVESTMENT STEWARDSHIP APPENDICES Royal Gold | 2025-2026 Investment Stewardship Report 28
Governance With a history of dedicated focus on rigorous oversight from our Board and its committees, coupled with the effective execution of strategies by our people, we are well positioned to not only navigate challenges but also to advance our business. This long-standing commitment to strong governance is an integral component of our approach to sustainable and responsible investment stewardship. IN THIS SECTION 30 Governance 31 Investment Stewardship Governance 34 Investment Stewardship Policies 35 Due Diligence and Portfolio Monitoring 39 Cybersecurity 40 Taxes, Associations and Political Contributions INTRODUCTION ABOUT ROYAL GOLD GOVERNANCE OUR PEOPLE OPERATORS AND COMMUNITIES INVESTMENT STEWARDSHIP APPENDICES Royal Gold | 2025-2026 Investment Stewardship Report 29
Governance Our Approach Royal Gold is dedicated to corporate governance practices that prioritize the long-term interests of our shareholders through robust oversight models established with the Board of Directors that foster accountability within our management team and nurture transparent relationships with Operators, employees and other stakeholders to build public trust in our Company. The Board, comprised of highly capable Directors with diverse skills and a majority of experience aligned with our business strategy, ensures vigilant oversight of the management team. Their valuable perspectives actively promote the best interests of Royal Gold and our stakeholders, while our talented management team, with significant industry and Company-specific experience, diligently implements our policies and practices. The Board oversees enterprise risk, with quarterly management reports and annual reviews of the ERM program, and directs management on aligning changes to the ERM program with the Company’s business strategy. A substantial part of the Board’s oversight responsibility is carried out through its standing committees. Several Board members, equipped with diverse experience in the many topics related to risk management and sustainability more broadly, apply this perspective to their oversight duties, enabling alignment of our practices with the interests of Royal Gold, its shareholders and other stakeholders. The figure illustrates the responsibilities of our Board and its committees. BOARD OF DIRECTORS Our Board oversees enterprise-level risk, including risks associated with strategy and operations AUDIT AND FINANCE COMMITTEE Integrity of financial statements Internal controls Disclosure controls and procedures Accounting compliance Cybersecurity Compliance program Capital structure and allocation MANAGEMENT Our management administers, reviews and updates our ERM program and provides quarterly reviews to our Board COMPENSATION, NOMINATING AND GOVERNANCE COMMITTEE Regulatory Board organization and membership Sustainability Succession planning Management development Executive compensation and retention Board Composition Our Board is composed of seven Directors. Five out of seven Directors, excluding our Chief Executive Officer (CEO), are independent. For an in-depth review of our Board and its committees, please refer to our Proxy Statement. 3 61-70 years 2 >70 years 2 51-60 years AGE 67 Years Average 3 10+ years 1 1-5 years 3 6-10 years TENURE 9 Years Average 2 5 INDEPENDENCE 71% Independence 43% 29% 14% Citizens From Another Country Women Ethnically or Racially Diverse INTRODUCTION ABOUT ROYAL GOLD GOVERNANCE OUR PEOPLE OPERATORS AND COMMUNITIES INVESTMENT STEWARDSHIP APPENDICES Royal Gold | 2025-2026 Investment Stewardship Report 30 Other public board service Each of our Independent Directors serves on one outside public company board, on average. 100% executive experience in the mining industry
Investment Stewardship Governance The Role of Our Board in Investment Stewardship The CNG Committee of the Board oversees investment stewardship. All committee members are independent under Nasdaq and SEC rules, including enhanced independence rules applicable to compensation committee members. Our CNG Committee determines the areas of expertise required to ensure maximum effectiveness of our Board and its committees for our specific business. The matrix here summarizes our Directors’ knowledge, skills and experience related to sustainability. The CNG Committee meets regularly with our senior management team to review investment stewardship and sustainability-related risks and opportunities related to our business strategy, including monitoring management practices and management’s progress on Company sustainability initiatives. This is detailed further in subsequent sections and is also addressed in Royal Gold’s 2026 Proxy Statement . Annual Stewardship Performance • During 2025, the Board held thirteen meetings, and the CNG Committee held five meetings. Sustainability, including human capital topics, were formally presented and discussed at all CNG Committee meetings. • The full Board reviewed the 2025-2026 Investment Stewardship Report in advance of publication. Self-reported sustainability-related knowledge, skills and experience Chubbs Hayes Heissenbuttel Isto Sokalsky Vance Veenman Biodiversity Climate Change Corporate Governance Cybersecurity Environment Health and Safety Human Capital (Talent, Attraction and Retention) Indigenous Relations Legal and Regulatory (Sociopolitical) Labor Relations Permitting Public Policy Risk Management Stakeholder Engagement Tailings Water Board Tenure Years 5 18 6 1 10 13 9 Some Experience + Extensive Experience INTRODUCTION ABOUT ROYAL GOLD GOVERNANCE OUR PEOPLE OPERATORS AND COMMUNITIES INVESTMENT STEWARDSHIP APPENDICES Royal Gold | 2025-2026 Investment Stewardship Report 31
Our Management Team’s Role in Investment Stewardship Our President and CEO has direct management responsibility for the risks inherent in the business, including sustainability risks such as climate change. The sustainability of our business largely depends on our ability to identify and manage risks inherent in our interests and is therefore central to the development of our corporate strategy and ongoing oversight. Enterprise Risk Management Committee Royal Gold’s ERM program aims to actively identify, assess and mitigate the Company’s top risks associated with its operations and revenue-generating properties. We organize our risks within a set of broad subjects that are captured in two subject areas. Business sustainability: We look to identify issues associated with changing laws and social dynamics within our portfolio and potential business opportunities. Investment portfolio performance: We look to identify issues that will impact the operations that generate revenue from our streams and royalties over the short, medium and long terms, which would capture issues associated with increasing costs or revenue loss. Enterprise risks, including sustainability risks, are monitored by the ERM Committee, which includes members of our senior management team. Input from other members of the Royal Gold team includes individuals responsible for new compliance and the technical assessment of our stream and royalty interests. The ERM Committee meets quarterly to consider present and potential risks to Royal Gold’s ongoing success and to determine mitigation strategies to execute as appropriate. Investment Stewardship Committee The Royal Gold Investment Stewardship Committee is responsible for ensuring that Royal Gold’s sustainability and sustainability initiatives are effectively monitored, managed and fulfilled and that issues are reported to the CNG Committee as appropriate. The Investment Stewardship Committee’s specific responsibilities include the following: • Annually review sustainability-related policies for relevance, recommending updates to the CEO for CNG Committee approval. • Recommend the investment stewardship strategy to the CEO, including priorities, objectives and initiatives related to training, target-setting, due diligence, surveys, reports, communication, standards, and assess emerging risks and opportunities aligned with Royal Gold’s ERM program. • Evaluate Operator sustainability performance and, in collaboration with the legal department, review Operator compliance with sustainability-related contractual standards. • Assess Operator philanthropic/social initiatives and explore opportunities for Royal Gold participation. • Review significant sustainability events for potential material reputational and/or financial risks to Royal Gold and/or its Operators. The Investment Stewardship Committee is a cross-functional management committee and consists of members of Royal Gold senior management with investment stewardship expertise in the following areas: sustainability, operations, compliance, finance, investor relations and legal. It is led by the Vice President of Investment Stewardship. Business Development Royal Gold’s senior management, led by our CEO, reviews all new investment opportunities. These individuals bring extensive experience in the technical, financial and legal aspects of mining project investment, development and operations. They may be supported by external experts in subject matter areas including the following: permitting, geology, resource estimation, construction, mining operations, geotechnical, metallurgy, ore processing, water, tailings management, energy and emissions, community and Indigenous engagement, biodiversity, political risk and off-take marketing and sales. The senior management team presents each particular investment opportunity above $25 million to the Board for final approval. INTRODUCTION ABOUT ROYAL GOLD GOVERNANCE OUR PEOPLE OPERATORS AND COMMUNITIES INVESTMENT STEWARDSHIP APPENDICES Royal Gold | 2025-2026 Investment Stewardship Report 32 Electrified operations, Kansanshi site visit, 2025
Investment Stewardship Alignment in Executive Compensation The CNG Committee sets annual targets for stewardship and risk management, which includes investment stewardship and sustainability performance as part of our annual short-term incentive compensation (bonus) program for all Company personnel. These targets are intended to align Company performance with the interests of our shareholders and other stakeholders. Sustainability, stewardship and risk management factors the Board considered in 2025 included publishing our fourth Investment Stewardship Report, publishing our second Asset Handbook, addressing issues commonly raised in investor engagement, TCFD disclosures, maintain carbon neutrality and strengthening our academic scholarships and donations program. Strategic Planning Our management team meets to discuss corporate strategy, including annual, short-term and long-term goals. Our investment stewardship strategy is reviewed annually, at a minimum, by our President and CEO together with senior management and is modified as necessary as part of our corporate strategic planning and ERM processes. Senior management then presents relevant updates to the CNG Committee. This input from Royal Gold management to the Board and its committees enables an integrated approach to sustainability as part of our overall risk management effort. Management’s process for reviewing sustainability matters is summarized in the figure below. Board of Directors Reports quarterly and as otherwise appropriate Reports quarterly and as otherwise appropriate to the CNG Committee Opportunity-specific presentation materials to full Board (two separate meetings) Provides direction and approvals/ rejections as required Oversight and direction provided as required; ERM program reviewed annually Strategic plan presented annually ENTERPRISE RISK MANAGEMENT INVESTMENT STEWARDSHIP COMMITTEE BUSINESS DEVELOPMENT CORPORATE STRATEGIC PLANNING Senior management team Considers present and potential risks to Royal Gold’s ongoing success, including ESG and climate change considerations, and determines appropriate risk mitigation actions and strategies Senior management team Ensures that Royal Gold’s sustainability initiatives are effectively monitored, managed and fulfilled Senior management team Ensures that Royal Gold completes thorough due diligence and risk assessments for potential new stream and royalty opportunities, including climate and climate change risks Senior management team Comprehensive strategic plan, including sustainability and climate change objectives, with short-term and long-term goals RISKS AND OPPORTUNITIES INTRODUCTION ABOUT ROYAL GOLD GOVERNANCE OUR PEOPLE OPERATORS AND COMMUNITIES INVESTMENT STEWARDSHIP APPENDICES Royal Gold | 2025-2026 Investment Stewardship Report 33
Investment Stewardship Policies For Royal Gold, governance is grounded in a suite of Board-approved policies and codes that collectively establish the framework by which we conduct our internal and external business operations. All policies are regularly reviewed by our Board or a Board committee and updated as necessary. These policies apply to Royal Gold, Inc. and all of its subsidiaries. Links to our corporate policies are in the Document Library section of our website, along with our bylaws and Board committee charters. The list below highlights policies with significant sustainability relevance. Sustainability Policy Our Sustainability Policy sets forth our core commitment to furthering responsible mineral development as a means of creating long-term value for our stakeholders. People Policy We believe that our employees are our most important assets. Our People Policy outlines our dedication to maintaining a safe and healthy workplace that is free from harassment and discrimination. The People Policy also outlines Royal Gold’s approach to fostering an inclusive work environment where individuals are treated fairly and with respect and are given equal opportunities to develop and advance. Code of Business Conduct and Ethics Our Code of Business Conduct and Ethics provides the framework by which we commit to maintaining the highest ethical standards in our operations and our relationship to our employees, counterparties and other stakeholders. Anti-Corruption Policy Our Anti-Corruption Policy outlines our prohibitions against illegal and improper conduct, including bribery and corruption in all forms. Human Rights Policy Our Human Rights Policy provides a framework to ensure that human rights are respected in all Company operations. We believe that human rights are basic standards aimed to secure dignity and equality for all people. Royal Gold is committed to respecting internationally recognized human rights standards. Standards for Suppliers and Operators Our Standards for Suppliers and Operators (formerly referred to as the Supplier Code of Conduct) outline expectations regarding standards of conduct expected from suppliers and Operators that conduct business with us. When selecting new interests or undertaking other relationships with suppliers and Operators, we consider whether potential suppliers and Operators hold values and promote practices that, as applicable, align with our Standards, and we intend to show preference for those suppliers and Operators that demonstrate alignment with our Standards. Whistleblower Policy Our Whistleblower Policy encourages and enables the reporting of any suspected illegal activities, unethical behavior or other misconduct. The Whistleblower Policy is intended to provide a means for Directors, officers and employees of the Company and other stakeholders to report serious concerns that could have a negative impact on Royal Gold or its stockholders, such as actions that may lead to false or inaccurate financial reporting, are unlawful, are not in line with Company policy or otherwise amount to serious improper conduct. INTRODUCTION ABOUT ROYAL GOLD GOVERNANCE OUR PEOPLE OPERATORS AND COMMUNITIES INVESTMENT STEWARDSHIP APPENDICES Royal Gold | 2025-2026 Investment Stewardship Report 34 New Horizons community construction in Cotuí, Dominican Republic, Pueblo Viejo site visit, 2025
Due Diligence and Portfolio Monitoring Royal Gold’s investment strategy plays a crucial role in responsible stewardship. By aligning the strategy with sound sustainability principles, we consistently demonstrate a commitment to sustainable and ethical practices. Our rigorous due diligence helps identify opportunities that align with the Company’s values and long-term goals. This process, central to our business model, involves seeking out and promoting responsible and sustainable mineral development across our portfolio. A comprehensive understanding of the Company’s assets is also an essential component of responsible investment stewardship, which involves ongoing monitoring and assessment of our stream and royalty interests. Risk evaluation is a foundational element of our extensive due diligence process on prospective stream and royalties to identify which opportunities will provide long-term value. Our active monitoring of stream and royalty interests within the portfolio also considers sustainability-related factors that contribute over the long term. Sustained economic performance generally cannot be obtained without sound investment stewardship practices; therefore, the sustainability of our stream and royalty interests is fundamental to our long-term success. Our Approach While we do not take an active role in the management of the mining projects in which we hold stream and royalty interests and generally have limited or no influence over the decisions of the Operators, it has always been central to our business model that successful mining projects create sustainable benefits for all stakeholders, including shareholders, project labor and local communities. In line with our Sustainability Policy, we therefore seek to promote responsible and sustainable mineral development across our portfolio. Royal Gold endorses the ICMM Mining Principles and the World Gold Council’s Responsible Gold Mining Principles (WGC RGMPs), both of which promote ethical and sustainable resource development. These principles are integrated into Royal Gold’s business planning and operations, as appropriate, and we encourage the Operators to adhere to these or similar principles in their management and operations. In due course, we will support the Consolidated Mining Standard Initiative (CMSI) once the ICMM Mining Principles and WGC RGMPs are sunsetted. CSMI will replace and combine the Copper Mark, the Mining Association of Canada’s Towards Sustainable Mining, the WGC RGMP’s and ICMM’s Mining Principles into one global standard that reduces complexity and clarifies responsible practices for mining companies of all sizes across all locations and commodities. The standard is expected to be finalized in 2026. For the 2025 calendar year, Operators responsible for generating more than 90% of our revenue endorsed either the WGC RGMPs or the ICMM Mining Principles and/or subscribed to one or more similar sustainability initiatives. Please see the Appendices, starting on page 77 , which identify the Operators, their calendar year 2025 contributions to Royal Gold revenue and the sustainability initiatives to which each Operator subscribes. Our Process Our investment due diligence process is a critical time to identify any potential sustainability, technical and governance risks prior to entering into an agreement with an Operator or purchasing a royalty from a third party. Royal Gold’s senior management team is responsible for completing due diligence reviews and assessing findings from those reviews. For each new investment opportunity, our team conducts an internal Phase 1 review — a high-level and typically internal review of, as appropriate, financial, technical, legal, political and sustainability risk considerations. If the results of the Phase 1 are positive, the opportunity moves to a more detailed Phase 2 review encompassing a more detailed review. For the technical Phase 2 review, there is a more detailed evaluation. A team of subject matter experts is assembled, from both within our organization and from external advisors, to provide in-depth assessments on a variety of considerations for a potential investment. OPERATOR EXPECTATIONS When selecting new investments or undertaking other relationships with suppliers and Operators, Royal Gold considers whether potential suppliers and Operators hold values and promote practices that align with our Standards for Suppliers and Operators, as applicable. Royal Gold seeks to build mutually beneficial working relationships with suppliers and Operators and intends to show preference for those that demonstrate alignment with our standards. Suppliers and Operators are expected to comply with the laws of the jurisdictions in which they operate, including those concerning health and safety, human rights, the environment, bribery and corruption, securities and taxes. We also encourage the Operators to pursue, where possible, internationally recognized best practices for improvements in environmental performance related to water and energy conservation, biodiversity management, pollution control, tailings management and reduction of GHG emissions. Where possible, Royal Gold seeks contractual standards for and monitors Operator compliance with the relevant portions of these Standards. Please refer to our Standards for Suppliers and Operators for more details. INTRODUCTION ABOUT ROYAL GOLD GOVERNANCE OUR PEOPLE OPERATORS AND COMMUNITIES INVESTMENT STEWARDSHIP APPENDICES Royal Gold | 2025-2026 Investment Stewardship Report 35
Typical thematic areas include: • Geology, including exploration potential • Resource estimation • Mining methodology • Mine geotechnical stability • Metallurgy and ore processing • Location consideration — proximity to protected areas of high biodiversity, indigenous lands, climatic conditions • Environmental impacts • Community impacts • GHG emissions and climate change • Permitting, including local view of ongoing or future permitting requirements • Political risk • Project execution and capital cost • Tailings storage and waste rock management • Water supply, water consumption and water management • Infrastructure • Closure plans • Project mineral title • Local law on creditor rights • Local and cross border tax considerations • Operator/project financial health We find that each investment opportunity has unique aspects that vary widely and that each evaluation opportunity requires a project-specific due diligence scope and team. The team for each opportunity will require appropriate technical experts as well as experts with knowledge of the local operating environment, which could include, for example, a third-party expert with specific knowledge of permitting or local community dynamics within a given jurisdiction. Our phased approach to project reviews allows the use of our Phase 1 review findings to develop a unique due diligence scope of work tailored to identify the skills needed on the due diligence team for Phase 2. In areas deemed to have a high level of risk, we often include two experts to develop our findings on a given topic. A summary example of our typical Phase 2 Due Diligence Team is provided in the figure on this page. Due Diligence Team Basic team includes: • Project Coordinator (Royal Gold leader) • Geologist • Resource Geologist • Mining Engineer • Metallurgist • Tailings Facility Engineer • Environmental/Permitting/Social Expert • Infrastructure Expert • Local legal counsel • Local and international tax advisors Greenfield projects include: • Capital Cost Estimator/Project Controls Expert • Capital Cost Benchmarking Expert Specialty experts include: • Hydrologist/Hydrogeologist • Geotechnical Engineer • Specialty Metallurgical Expert • Country-Specific Environmental, Social or Permitting Expert • Community/Indigenous Relations Expert • Biodiversity Expert • Country/Political Risk Expert All Phase 2 due diligence activities are coordinated by Royal Gold management. This phase of due diligence typically consists of a review of publicly available information as well as confidential information provided by the counterparty. The Phase 2 due diligence process typically affords an opportunity to interact with project and corporate management. This interaction can include virtual presentations, video conference calls, in-person question and answer sessions, site visit and meeting with project stakeholders. An assessment of the potential counterparty’s capacity to successfully execute its plan is a critical consideration of the due diligence process. The ability of Royal Gold to interact with project management is determined by the investment opportunity. For example, the opportunity to purchase a third-party royalty on a mining operation may not allow for communications with the Operator, as the royalty is not being sold by the operation’s owner. Conversely, the negotiation purchase of a metal stream is typically with an owner of the mine or project, which allows for direct access to the management team. Royal Gold always endeavors to interact with project management as directly as possible. Upon completion of the Phase 2 due diligence, multiple deliverables are produced to document the due diligence team findings. These include, the following: • Subject Matter Expert Reports — reports prepared by team members for their thematic review area • Value Drivers and Risk Workbook — a compilation of key findings, risks and actions to mitigate identified risks with contributions from all due diligence team members • Sustainability Checklist — a comprehensive document driving the collection and recording of sustainability-related information Due diligence findings provide the content for a Due Diligence Findings Management Presentation that summarizes the work completed and critical findings, with contributions from all team members. The process as described is represented in the figure below. Phase 1 Review Phase 2 Review Due Diligence Design Due Diligence Team Selected Technical Scope Defined Critical/Unique Issues Recognized Interviews Site Visit Data Analysis Information Review Management Presentations Sustainability Checklist Value Driver and Risk Workbook Subject Matter Expert Reports Due Diligence Findings Management Presentation INTRODUCTION ABOUT ROYAL GOLD GOVERNANCE OUR PEOPLE OPERATORS AND COMMUNITIES INVESTMENT STEWARDSHIP APPENDICES Royal Gold | 2025-2026 Investment Stewardship Report 36
Technical Monitoring We actively monitor our stream and royalty interests to understand the Operators’ economic and operational health and their social license to operate. Our stream agreements typically have extensive information rights while our royalty agreements typically do not provide us with a contractual right to detailed, non-public information. In these instances, we rely on public disclosures by the Operators, which include their quarterly and annual reporting, sustainability, climate and modern slavery reports, among other reports, and a positive working relationship with the Operators to obtain our monitoring data. Where we have the right to do so, we often perform site visits to interface with Operator management teams and gather information and insights that are not available from public disclosures by the Operators. In addition, we rely on third-party information sources that: • Aggregate and vet site-specific data with respect to energy, GHG emissions and water usage, along with associated usage intensity • Aggregate information, with respect to tailing storage facilities, using a third-party with geotechnical expertise • Collect negative ESG news events and rank ESG reputational risk on the bases of asset, company and country • Systematically collect news articles relating to the Operators and projects • Collect digital satellite images of selected properties on an as-needed basis A graphical representation of our monitoring initiatives and our third-party information providers is in the figure to the right. TAILING STORAGE FACILITIES Site-specific characteristics Hazard ratings Third-Party Engineering Firms AGENTIC PROPERTY MONITORING OPERATOR REPORTING Monthly Site Reports Annual Site Visits Issue Discussions With Management Sustainability Reports and Data Asset Owner Public Disclosure EXTERNAL DATA SOURCES Energy and GHG Emissions and Intensities Water Consumption and Intensities Asset Monitoring Information Sources REMOTE VISUAL TRACKING High-resolution satellite monitoring to understand development, disturbance and event impacts DAILY NEWS FLOW Systematic collection of news flow from our complete portfolio of assets ESG EVENT TRACKING Tracking of asset and parent company monitoring for negative ESG events and overall ESG Risk INTRODUCTION ABOUT ROYAL GOLD GOVERNANCE OUR PEOPLE OPERATORS AND COMMUNITIES INVESTMENT STEWARDSHIP APPENDICES Royal Gold | 2025-2026 Investment Stewardship Report 37 Canada site visit, 2026
ROYAL GOLD PORTFOLIO REPRISK INDEX RRR Calibration and Risk Indication AAA, AA, A – low ESG risk exposure BBB, BB, B – moderate ESG risk exposure CCC, CC, C – high ESG risk exposure D – very high ESG risk exposure Circle size denotes asset relative net GEOs. • ROYAL GOLD 2025 SOUTH LAVERTON North Star Resources Ltd. VOISEY'S BAY Vale S.A. RAINY RIVER Coeur Mining, Inc. CORTEZ Nevada Gold Mines LLC MOUNT MILLIGAN Centerra Gold Inc. MARIGOLD SSR Mining Inc. ROBINSON KGHM Polska Miedz SA ANDACOLLO Compania Minera Teck Carmen de Andacollo EL LIMON Equinox Gold XAVANTINA Ero Copper WASSA Golden Star Resources Ltd PEÑASQUITO Minera Peñasquito SA de CV KHOEMACAU MMG Limited PUEBLO VIEJO Pueblo Viejo Dominicana Corp KANSANSHI First Quantum Minerals MANH CHOH Kinross Gold Corporation LEEVILLE NORTH Nevada Gold Mines LLC LARONDE ZONE 5 Agnico Eagle Mines Ltd. Jurisdictional Risk Understanding the jurisdictional risks of a project’s ongoing or planned operations is a key component of both our due diligence review and portfolio monitoring processes. As part of our evaluation of a potential new business opportunity, we assess geopolitical risk and consult third-party experts when necessary for an independent perspective on the political, social and permitting environment in the country where the opportunity or operation is located. In addition, as part of our review for new business opportunities and for portfolio monitoring, we consult RepRisk , an ESG analytics firm, to understand ESG and business conduct risk. RepRisk maintains a database that assigns ESG risk scores to both companies and countries. The RepRisk Index (RRI) is a proprietary algorithm that dynamically captures and quantifies the reputational exposure to ESG risks. The RRI ranges from 1 (lowest) to 100 (highest). Our assessments track the Peak RRI for both countries and operating companies, which reflects the highest risk rating in the last two years. The Country RRI provides accurate and dynamic information on ESG risks and how they impact companies doing business or investing in a specific country. It provides meaningful insights into potential financial, reputational and compliance risks, such as human rights considerations, poor working conditions, corruption and environmental degradation. Using both the RRI for operating companies and the Country RRI where operations are situated allows us to assign a RepRisk Rating (RRR) for an asset, which ranges from AAA to D. The Royal Gold Portfolio RepRisk Index (left) provides a portfolio assessment of the ESG reputational risk, weighted by 2025 revenue from each asset. Overall, our portfolio has a weighted average RRR of A. This is a modest increase in risk RRR from the prior year due to the addition of Kansanshi to the portfolio. The results indicate a high-quality portfolio with zero revenue from assets carrying an ESG risk rating of D. INTRODUCTION ABOUT ROYAL GOLD GOVERNANCE OUR PEOPLE OPERATORS AND COMMUNITIES INVESTMENT STEWARDSHIP APPENDICES Royal Gold | 2025-2026 Investment Stewardship Report 38
Cybersecurity AT Royal Gold, cybersecurity is a shared responsibility across our entire organization Continued investment in employee training ensures that we stay vigilant against cyber threats, protecting our data, our business and the trust of our partners Our Cybersecurity Disclosure Policy and Incident Response Plan establish acceptable uses of electronic devices, communications systems and network resources as well as a framework for reporting and managing cybersecurity incidents. Our Board and senior management oversee matters relating to cybersecurity. Under its charter, the Audit and Finance Committee of our Board is responsible for reviewing the security of our information technology systems and operations, including programs and defenses against cyber threats. The full Board is briefed on cybersecurity at least annually and receives more frequent updates as needed. Our Audit and Finance Committee has direct oversight for cyber risk and receives quarterly updates. Our Senior Vice President and Chief Financial Officer is responsible for cybersecurity matters at the management level. Employees complete cybersecurity training programs semiannually or more frequently as warranted by changes to the business operating environment. CYBER RISK SCORE Low Risk High Risk ISS Cyber Risk Score as of June 2026 1 In 2025, 100% of Royal Gold employees completed cybersecurity training. INTRODUCTION ABOUT ROYAL GOLD GOVERNANCE OUR PEOPLE OPERATORS AND COMMUNITIES INVESTMENT STEWARDSHIP APPENDICES Royal Gold | 2025-2026 Investment Stewardship Report 39 1. The Information Security Standard (ISS) Cyber Risk Score predicts the likelihood of an organization suffering a material cybersecurity breach within a 12-month period
Taxes, Associations and Political Contributions Tax Royal Gold’s Tax Policy aligns with all applicable laws and Company policies, prioritizing integrity, compliance and disclosure. Operating in multiple jurisdictions, we paid significant income and withholding taxes from 2020 to 2025, mainly in the United States, Mexico, Switzerland and Canada. Apart from these, we manage production taxes on royalty payments, government royalties, mineral rights taxes, value-added tax (VAT), harmonized sales tax (HST) and goods and services tax (GST). For 2025, these non-income taxes are included in the costs and expenses section of our consolidated statements of operations and comprehensive income in the financial statements included in our Annual Report on Form 10-K. INCOME AND WITHHOLDING TAXES PAID (US$M) 9 19 14 14 34 41 8 17 17 10 12 11 7 11 19 19 19 30 4 9 2 8 5 4 7 7 10 2020 2021 2022 2023 2024 2025 0 10 20 30 40 50 60 70 80 90 100 • U.S. • Canada • Mexico • Other (Argentina, Australia, Bolivia, Brazil, Burkina Faso, Chile, Nicaragua, Spain, Turkey) • Switzerland Includes income and withholding taxes. Memberships and Industry Associations Royal Gold has been a long-standing member of the following industry associations and organizations. Below is a list of our memberships and corresponding annual fees paid. Organization Fees paid in 2025 National Mining Association $90,843 In Gold We Trust $31,668 NBC Universal Media $18,749 World Gold Council $14,270 National Association of Corporate Directors $12,825 Canadian Swiss Chamber of Commerce $6,171 Women in Mining $5,000 The Denver Gold Group $3,000 Other tax-exempt groups (under $2,000 per group) $8,202 Total $190,728 Political Contributions Royal Gold’s Code of Business Conduct and Ethics states that corporate funds may not be provided to political candidates, entities or organizations without the written consent of our CEO or, in the case of a political contribution suggested by our CEO, the Chair of the Audit and Finance Committee of our Board. This includes direct cash contributions, donation of property or services and purchases associated with fundraising events. We made no political contributions between 2019 and 2025, and we intend to disclose any future political contributions in this report. INTRODUCTION ABOUT ROYAL GOLD GOVERNANCE OUR PEOPLE OPERATORS AND COMMUNITIES INVESTMENT STEWARDSHIP APPENDICES Royal Gold | 2025-2026 Investment Stewardship Report 40 Khoemacau site visit, 2025
Our People Building and cultivating an exceptional workforce is crucial to delivering excellence to our stakeholders. Beyond competitive compensation and career growth, today’s workforce seeks connection with a company’s core values. We are dedicated to creating a workplace that attracts top talent and provides a sense of purpose in every professional journey. IN THIS SECTION 42 Talent Attraction and Retention 43 Human Capital 44 Health, Safety and Wellness INTRODUCTION ABOUT ROYAL GOLD GOVERNANCE OUR PEOPLE OPERATORS AND COMMUNITIES INVESTMENT STEWARDSHIP APPENDICES Royal Gold | 2025-2026 Investment Stewardship Report 41
Talent Attraction and Retention Attracting, securing, developing and continually engaging our employees is key to our success. The complexity of providing financing for mining projects worldwide demands a high-performing and collaborative team with a diverse set of backgrounds, skill sets, experience and perspectives to ensure that we meet our business objectives. Our Approach With significant experience in the key disciplines of geology and mining operations as well as project development, finance, accounting and law, we seek to expose our people to a variety of projects and involve them in key business decisions. We believe this approach helps our employees expand their skills by creating meaningful experiences, which in turn results in advancing Company objectives. Our comprehensive compensation package includes competitive wages, health and dental benefits, and various insurance coverage. We regularly benchmark all levels of wages and total compensation and ensure that the majority of all short-term incentive compensation is based on corporate-wide, shared benchmarks. The following personal development opportunities are an important part of our culture and help inspire and motivate our team: Continuing education and skill enhancement: We offer financial support to employees and Directors who wish to enhance their education in areas key to our business. Secondments: Employees are welcome to broaden their skills and perspectives through secondment opportunities across our offices and to apply these perspectives when they return to their role. Succession planning: Ensuring a robust succession plan at all senior management levels, including our Board, is imperative, given the flat structure of our organization. Emerging talent experiences the boardroom, the field and educational opportunities, which fosters a comprehensive understanding of the Company in a positive environment that encourages knowledge-sharing. Employee Statistics and Talent Retention The sustained growth and success of our business rely on the well-being of our people. We firmly believe that our approach to nurturing personal and career development opportunities, combined with a strong record of internal promotion, contributes to our very low voluntary turnover rate. As of December 31, 2025, Royal Gold maintained a small but efficient team of 39 employees. The value generated per employee highlights the efficiency of our business model, underscoring the importance of retaining our workforce. With a commendable track record, the Company consistently maintains a low average voluntary turnover rate, excluding retirements of long-serving staff members. Royal Gold’s retention rate in 2025 was 100% for all employees. INTRODUCTION ABOUT ROYAL GOLD GOVERNANCE OUR PEOPLE OPERATORS AND COMMUNITIES INVESTMENT STEWARDSHIP APPENDICES Royal Gold | 2025-2026 Investment Stewardship Report 42
Human Capital Royal Gold strives to foster a work environment where individuals of all backgrounds are treated fairly and with respect and are given the opportunity to make contributions, grow professionally and reach their full potential. The wide array of perspectives and experiences of our Board of Directors and workforce enhances creativity, productivity and overall organizational strength. We are committed to providing equal opportunities for promotion, compensation, training and development to all qualified individuals. Royal Gold continued its programs of personnel training and investment in human capital throughout the year. We recognize and value the benefits that a talented and dedicated workforce brings to Royal Gold. The success of our business depends heavily on the quality and skills of our people. TOTAL NUMBER OF EMPLOYEES (AS OF DECEMBER 31) 29 29 31 30 30 29 39 2019 2020 2021 2022 2023 2024 2025 0 6 12 18 24 30 36 42 EMPLOYEE STATISTICS 2025 2024 2023 2022 2021 2020 Recordable health and safety incidents 0 0 0 0 0 0 Total Employee Turnover 0 0 0 1 1 3 Annualized employee turnover rate 0% 7% 0% 3% 3% 7% WORKFORCE DEMOGRAPHICS 2025 2024 2023 2022 2021 2020 Total number of employees (as of December 31) 1 39 29 30 30 31 29 Number of male employees 2 15 NR 14 15 17 NR Percent of male employees 2 52% NR 52% 56% 59% NR Number of female employees 2 14 NR 12 12 12 NR Percent of female employees 2 48% NR 44% 44% 41% NR Percent of employees identifying as racially and/or ethnically diverse 3 13% NR 7% 7% 4% NR SENIOR MANAGEMENT 2025 2024 2023 2022 2021 2020 Male senior management 89% NR 75% 80% 87% 87% Female senior management 11% NR 25% 20% 13% 13% 1. Total employee headcount is not based on the employee survey. 2. Ten employees elected to not disclose their gender and, therefore, are not reflected in the totals 3. Nine employees elected to not disclose their race/ethnicity and, therefore, are not reflected in the totals. INTRODUCTION ABOUT ROYAL GOLD GOVERNANCE OUR PEOPLE OPERATORS AND COMMUNITIES INVESTMENT STEWARDSHIP APPENDICES Royal Gold | 2025-2026 Investment Stewardship Report 43
Health, Safety and Wellness The well-being of our employees encompasses more than workplace safety and travel precautions; it extends to their entire professional experience, covering the work environment and work–life balance. While our operations are primarily office- based, numerous employees travel to remote global locations. Our policies mandate compliance with legal and applicable health and safety requirements, including compliance with Operators’ health and safety procedures during site visits. Routine safety training occurs at all of our offices and addresses various threats like medical emergencies, fire, extreme weather and physical office intrusions. Royal Gold is committed to the well-being, including the physical and mental health, of all Company employees and their families. Headquarters Royal Gold’s headquarters are located in downtown Denver, Colorado, in a Hines-managed property referred to as “1144 Fifteenth.” Just over half of our employees are based at 1144 Fifteenth, which features state-of-the-art amenities, including a 5,000-square- foot fitness center, a tenant lounge and a coffee shop. It is among the most energy-efficient and environmentally friendly office spaces in Denver. The 1144 Fifteenth building achieved certification at the Gold level under the U.S. Green Building Council’s Leadership in Energy and Environmental Design (LEED) rating system, has an advanced air filtration system and a 10% higher energy efficiency rate than rival structures. The destination dispatch elevators use optimization technology to group passengers for maximum efficiency. Our Vancouver office is located in a LEED Platinum certified building, which is the highest certification available. By occupying two LEED-certified buildings, Royal Gold benefits from sustainability and wellness features including recycling programs, exercise facilities, emission-reduction initiatives, and building modernization that of which are managed by the building operators rather than by Royal Gold directly. The 1144 Fifteenth building maintains a WELL Health Rating by the International WELL Building Institute (IWBI™), which is leading the global movement to transform our buildings and communities. The WELL Health Safety Rating helps buildings and organizations address the health, safety and well-being of their most valuable asset: their people. None of the Royal Gold offices generate emissions from nitrogen oxides, sulfur oxides, volatile organic compounds or any hazardous waste. All of our offices have recycling programs and our Canadian offices have especially robust composting programs. As a small-office based company located in larger buildings, Royal Gold has limited opportunities to reduce energy consumption from non-renewable resources or achieve waste reduction strategies. The company has no direct waste water discharge. All of our offices have emergency preparedness procedures and training to the region where each office is located. This includes CPR, fire and earthquake training which occurs annually. Employee Travel Company interests may require employees to travel to attend meetings or conferences or to visit mine sites. Royal Gold maintains a Travel Policy that outlines protocol for all employee business travel. Royal Gold uses SOS International Services, when required, to deliver medical and emergency response services and evacuation assistance for our employees while traveling abroad. Work-Life Balance We strive to maintain fair and flexible work and leave policies that facilitate work-life balance. Recognizing that technology has enabled many of our employees to effectively perform their duties from outside the office, Royal Gold’s remote work policy enables eligible employees to work remotely when applicable. Our policies also provide for paid leave for annual vacation time as well as personal reasons such as medical, bereavement, parental leave and leave for charitable volunteering. Our medical leave policy covers an employee’s leave for health concerns of the employee and their eligible dependents. Royal Gold provides competitive medical insurance, including for mental health, and other coverage for employees and their eligible dependents. INTRODUCTION ABOUT ROYAL GOLD GOVERNANCE OUR PEOPLE OPERATORS AND COMMUNITIES INVESTMENT STEWARDSHIP APPENDICES Royal Gold | 2025-2026 Investment Stewardship Report 44 Royal Gold Director, Fabiana Chubbs, Andacollo site visit, 2025
Supporting Operators and Communities We actively seek ways to address the needs of the communities where we live and work. By partnering with philanthropic organizations, we can support our local communities and the Operators in achieving their SDGs and contribute to social resiliency. IN THIS SECTION 46 Community Investment 47 Mining Community Investment Highlights 51 Local Office Community Investment Highlights 53 Future Leaders in Responsible Mining Scholarship INTRODUCTION ABOUT ROYAL GOLD GOVERNANCE OUR PEOPLE OPERATORS AND COMMUNITIES INVESTMENT STEWARDSHIP APPENDICES Royal Gold | 2025-2026 Investment Stewardship Report 45
Community Investment Our Approach Supporting the communities in our corporate office locations and near the mines in which we hold stream and royalty interests is at the core of Royal Gold’s stewardship efforts. Contributing to community organizations allows for us to have a meaningful impact as it is important for Royal Gold to remain neutral as a passive investor. We acknowledge the Operators’ demanding roles in mining operations and understand their limited capacity for additional projects. To address this, we collaborate with a variety of philanthropic organizations that act as the project facilitators, which helps to ensure effective community engagement while allowing Operators to concentrate on their primary responsibilities. Our internal Donations Committee administers our annual giving and selects donation recipients associated with our local office communities, projects associated with our mining Operators, organizations that support mining and university scholarships. The Donations Committee comprises four senior managers and meets quarterly to discuss and review potential programs and projects to support. In 2025, Royal Gold contributed $1.56 million to support organizations that serve needs in the communities near our corporate offices and to support Operator initiatives. We have contributed more than $11 million to more than 130 philanthropic organizations since Royal Gold’s inception. Please visit our website to learn more about the organizations we support. TARGET $1.5M in 2025 to support organizations that serve the needs of the communities in which our corporate offices and Operators are located CONTRIBUTED $1.56M in 2025 to local charities and mining-related sustainability projects The United Nations SDGs are a set of 17 global goals adopted by all UN Member States in 2015 as a universal call to action to put the world on a more sustainable path. Throughout this report, we indicate where our corporate and Operator contributions align with the SDGs. Please see page 134 for our SDG Index. INTRODUCTION ABOUT ROYAL GOLD GOVERNANCE OUR PEOPLE OPERATORS AND COMMUNITIES INVESTMENT STEWARDSHIP APPENDICES Royal Gold | 2025-2026 Investment Stewardship Report 46
Mining Community Investment Highlights Royal Gold’s mining community contributions support programs in the communities where we hold stream or royalty interests that promote sustainable development, globally. Royal Gold supports programs that achieve impactful, measurable and sustainable outcomes that align with one or more of the SDGs. Royal Gold has been a long-time contributor to Operator community programs and partnerships worldwide. In the communities where we have our existing interests, we’ve supported various voluntary, community-related initiatives. The following pages highlight some of our most recent mining community investment projects. All of these projects are funded in coordination with the Operators. Project C.U.R.E. Since 1987, Project C.U.R.E. has been dedicated to addressing the critical shortage of medical resources in underserved communities around the world. As the world’s largest distributor of donated medical supplies, equipment, and services, Project C.U.R.E. works to identify, source, collect, sort, and deliver life-saving materials to healthcare professionals serving the sick and vulnerable in more than 135 countries. Project C.U.R.E. and Royal Gold have been in partnership since 2020, where we have collaborated to support frontline healthcare workers during Covid, provision medical supplies and equipment in under- resourced health facilities worldwide and strengthen Project C.U.R.E.’s capacity from its distribution centers in the United States. In 2025, the two organizations embarked upon a new partnership strategy to positively impact specific healthcare facilities by securing the delivery of medical containers in two of Royal Gold’s Operators’ countries, including Ghana and Botswana. PROJECT C.U.R.E., WASSA MINE, NEEDS ASSESSMENT In August 2025, Rebecca Weber, a trained Project C.U.R.E. Needs Assessor, was deployed to visit 10 government-funded health facilities in the vicinity of the Wassa Mine, all of which work under the Ghana Health Service. The mix of medical facilities visited included rural and Community-based Health Planning and Services (CHPS) compounds that provide basic medical care and testing. These facilities work together to care for the people of the community. The purpose of the visit was to complete a Needs Assessment, which is a crucial part of the process before medical equipment can be delivered. The completion of the Needs Assessment (or Step 2 of the C.U.R.E. Cargo Process, as described on the following page) is when a Project C.U.R.E. representative travels to the recipient hospital or clinic to determine the specific needs before medical supplies and equipment are delivered. This step includes in-person meetings with staff, touring of facilities and a detailed analysis of current medical operations. The goal of this step is to ensure that future donated cargo containers meet the specific needs of the recipient, maximizing impact. Royal Gold funded a Needs Assessment for the Toteng Clinic near the Khoemacau Mine in Botswana in 2022. The Project C.U.R.E. visit to Ghana was undertaken in collaboration with Royal Gold as the funding sponsor and mining operator, Golden Star Resources Ltd./ Chifeng Jilong Gold Mining Co, Ltd. as the host. Rebecca Weber Project C.U.R.E. Needs Assessor, Visiting the Wassa mine health clinics in 2025 [Watch this video to learn more about the Needs Assessment conducted in Ghana.] INTRODUCTION ABOUT ROYAL GOLD GOVERNANCE OUR PEOPLE OPERATORS AND COMMUNITIES INVESTMENT STEWARDSHIP APPENDICES Royal Gold | 2025-2026 Investment Stewardship Report 47
Project C.U.R.E. Our host communities are one of our most important stakeholders, and we are committed to supporting initiatives that contribute meaningfully to their wellbeing. We are therefore pleased to collaborate with Royal Gold and Project C.U.R.E. on this health needs assessment initiative to identify priority healthcare gaps within our host communities. This assessment, conducted in health facilities at Akyempim, Ateiku, Nsadweso, Benso, Brofoyedro and Mpohor (near the Wassa mine), is an important step toward improving access to essential health resources and better health outcomes for individuals and families across our host communities. Following the assessment, medical supplies aligned with the identified needs are currently being mobilized for delivery to the beneficiary health facilities.” Mr. Gerard Boakye Deputy Director, HR, Corporate Affairs and Security, Golden Star Resources Ltd. Following a successful Needs Assessment, in November 2025, a container allocation strategy was finalized in collaboration with Golden Star Resources Ltd. Through this coordinated approach, two containers were strategically divided to ensure equitable distribution among four health facilities—Akyempim Community Clinic, Ateiku Health Center, Benso Health Center, and Nsadweso CHPS Compound—with each facility receiving 0.5 container. This allocation strengthened last - mile delivery and maximized the reach of critical medical supplies to underserved communities. We anticipate the two containers, which were fully funded by Royal Gold, will be delivered in mid-2026.” Sumani Dash Director of Corporate Partnerships, Project C.U.R.E. PROJECT C.U.R.E., WASSA MINE, NEEDS ASSESSMENT THE C.U.R.E. CARGO PROCESS Following the completion of the Needs Assessment, Royal Gold made a further contribution which will fund the shipment of two (2) 40-foot ocean cargo containers full of medical supplies and equipment to the selected health clinics near the Wassa Mine in mid-2026. 1. Request for Assistance 2. Needs Assessment 3. Funding 4. Inventory Preparation 5. C.U.R.E. Cargo Delivery 6. Impact Evaluation SDG 3 Good Health and Well-Being Our long- standing partnership with Project C.U.R.E. has focused on improving access to medical equipment and services in both Operators’ local communities and the Colorado community. INTRODUCTION ABOUT ROYAL GOLD GOVERNANCE OUR PEOPLE OPERATORS AND COMMUNITIES INVESTMENT STEWARDSHIP APPENDICES Royal Gold | 2025-2026 Investment Stewardship Report 48
PROJECT C.U.R.E., KHOEMACAU MINE, MEDICAL CONTAINER DELIVERY In 2022, Royal Gold funded a Needs Assessment in coordination with Project C.U.R.E. for the Toteng Medical Clinic near the Khoemacau Mine in Botswana. Shortly thereafter, Royal Gold contributed $261,000 to complete the construction of the Toteng Medical Clinic, including the water tanks, pumping and cooling systems and mechanical equipment required by a medical clinic. After many meetings with the Government of Botswana, Khoemacau and Project C.U.R.E., a final import approval was secured in late 2024 to finally bring medical supplies and equipment into the country. We are thrilled to report that a container full of much needed medical supplies (with a value of $323,928) was successfully shipped to Toteng Medical Clinic in Botswana (Step 5 of the C.U.R.E. Cargo Process, as described on the previous page). This shipment aims to significantly enhance the facility’s capacity to provide essential healthcare services, address supply gaps and improve patient care outcomes. Together, these efforts demonstrate a measurable commitment to strengthening health systems through thoughtful logistics planning and effective cross - partner collaboration. The Botswana collaboration is especially noteworthy since this is the first medical cargo shipment to that country from Project C.U.R.E. Altogether, Royal Gold has helped support the delivery of $1.02 million worth of essential and critically needed medical supplies and equipment to Ghana and Botswana. INTRODUCTION ABOUT ROYAL GOLD GOVERNANCE OUR PEOPLE OPERATORS AND COMMUNITIES INVESTMENT STEWARDSHIP APPENDICES Royal Gold | 2025-2026 Investment Stewardship Report 49 Medical equipment delivery ceremony, Toteng Clinic, 2026
PROJECT HOPE, XAVANTINA MINE, BRAZIL Royal Gold has contributed $5 per ounce of gold delivered under its stream agreement with Ero Copper (“Ero”) since 2023. The focus of our contribution continues to support the Project Hope educational initiative located near the Xavantina Mine in Brazil. Project Hope was established in 1997 by the Municipal Department of Nova Xavantina City with the goal of providing educational opportunities for students aged 7 to 17 who come from vulnerable families. Ero Copper has had a long and successful partnership with the Hope Project and has been involved with the initiative since 2012. Since Royal Gold’s involvement, student participation has increased from 48 students in 2023 to 140 in 2026. The growth of the program continues to be a strong indicator of its positive impact on the local community. Ero Copper has also helped the program expand its reach by offering opportunities in music, art, technology and education while providing stability, care and a sense of belonging. SDG 2 Zero Hunger: The Hope Project provides children with a healthy eating routine and sustainable cooking practices. The program directly contributes to ending hunger and achieving food security. SDG 4 Quality Education: Project Hope works hard to ensure all children in the community have access to free, equitable and quality primary and secondary education. The project also aims to prepare children and young adults for future employment. INTRODUCTION ABOUT ROYAL GOLD GOVERNANCE OUR PEOPLE OPERATORS AND COMMUNITIES INVESTMENT STEWARDSHIP APPENDICES Royal Gold | 2025-2026 Investment Stewardship Report 50
Local Office Community Investment Highlights UNITED WAY, TORONTO, CANADA For more than 135 years, United Way has been working to improve lives by mobilizing the caring power of communities to advance the common good. United Way is a worldwide non-profit movement and in Canada, they operate in more than 100 communities. Royal Gold has been a supporter of the United Way Greater Toronto for over half a decade and has not only financially contributed over US$370,000 to the organization but has been an active participant in the organization. Alistair Baker, Royal Gold’s Senior Vice President, Investor Relations and Business Development, has been a United Way Community Campaign Cabinet Member since 2023. Each year, Alistair generously dedicates his time and expertise to helping unlock new philanthropic opportunities within the mining sector. He works closely with the United Way team—listening, advising, and sharing his experience—to help expand our network of supporters and advance our shared mission of lifting up the most vulnerable members of our community. "What we continue to see in 2025 is an affordability crisis affecting families across the Greater Toronto Area. Research from United Way Greater Toronto shows that one in four families in our region is living in poverty, and that 60 per cent of renters across Ontario are cutting back on food simply to keep a roof over their heads. No one should have to face this reality—yet for thousands of individuals and families across our shared communities, it is a daily struggle. This is why Royal Gold’s generous, ongoing support of United Way Greater Toronto has been so vital. Their partnership helps ensure that frontline agencies remain open, responsive, and equipped to address urgent needs related to housing stability, food security, mental health, employment, and more. With Royal Gold’s support, United Way Greater Toronto helps sustain more than 700 life changing programs each year—programs that enable people to secure safe housing and put healthy food on the table. We are also incredibly grateful for the consistent, thoughtful leadership of Alistair. We cannot thank Royal Gold enough for their collective commitment to United Way Greater Toronto. With partners like Royal Gold, we are able to change thousands of lives for the better each year—spreading hope, dignity, and opportunity across the Greater Toronto Area." Scott Kuipers, Corporate Donor Relations Manager at United Way Greater Toronto SDG 11 Sustainable Communities and Cities Royal Gold is contributing to the development of more sustainable communities by supporting United Way’s efforts to reduce housing instability and increase food security. INTRODUCTION ABOUT ROYAL GOLD GOVERNANCE OUR PEOPLE OPERATORS AND COMMUNITIES INVESTMENT STEWARDSHIP APPENDICES Royal Gold | 2025-2026 Investment Stewardship Report 51 I’ve been involved with United Way Greater Toronto for four years. I like the United Way because it is an organization that has the ability to raise money and redistribute it to partner agencies that are close to community needs. It also plays an important advocacy role when it comes to dealing with poverty and strengthening communities at the grassroots level." Alistair Baker Senior Vice President, Investor Relations and Business Development, Royal Gold Corporation
Food Bank of the Rockies, Denver, Colorado Royal Gold has been a long-time supporter of food banks and food assistance programs in the cities where our employees work. Specifically, Royal Gold has financially supported and volunteered at the Food Bank of the Rockies (Colorado, U.S.), the Greater Vancouver Food Bank (Vancouver, Canada), the Daily Bread Food Bank (Toronto, Canada) and We Don’t Waste (Denver, U.S.). Since 2020, Royal Gold has supported these organizations with a combined total contribution of $1,065,760. Together with an incredible group of focused and motivated volunteers, Royal Gold employees volunteered at the Food Bank in early 2025 where they packed and labeled one-pound bags of rice, preparing them for distribution to local food centers in need. By combining our employees’ efforts with the other volunteers, approximately 1,750 meals were prepared. SDG 10 Reduced Inequalities Royal Gold is helping bridge the gap between vulnerable, low-income populations and adequate food access. SDG 2 Zero Hunger Childhood hunger and food insecurity are tied to a variety of socioeconomic factors, the most predominate being poverty. Royal Gold has consistently supported four food providing organizations that aim to eliminate hunger in the communities where our offices are located. INTRODUCTION ABOUT ROYAL GOLD GOVERNANCE OUR PEOPLE OPERATORS AND COMMUNITIES INVESTMENT STEWARDSHIP APPENDICES Royal Gold | 2025-2026 Investment Stewardship Report 52
Future Leaders in Responsible Mining Scholarship Educating the industry’s next generation of mining leaders is a priority for Royal Gold, and we are committed to funding scholarships that support mining-related education. We recognize our responsibility to contribute to resource development in our sector, especially given that we expect workforce shortages to increase over time. SDG 4 Quality Education In 2025, Royal Gold increased its scholarship funding to six universities and technical programs in the U.S. and Canada, all of which have a deep commitment to STEM excellence and the mining industry. SDG 10 Reduce Inequalities Our scholarships support students studying mining who have also overcome significant barriers to higher education or demonstrate a meaningful commitment to expanding access and opportunity in the mining profession. The University of Nevada, Reno Foundation Established in 2023, the Royal Gold Scholarship of $25,000 supports students pursuing an undergraduate degree in the Mackay School of Earth Sciences and Engineering. The University of British Columbia A legacy Sandstorm contribution, Royal Gold will support the University’s Faculty of Applied Science Female Scholars at Risk Initiative until 2027. Great Basin College Foundation The $25,000 Royal Gold Scholarship, which was established in 2023, is awarded annually to selected students seeking education in the diesel, welding, industrial maintenance, electrical, instrumentation, and machinist technology programs (together, the Career and Technical Education Program). Montana Technological (Montana Tech) University Foundation Royal Gold has a $30,000 annual scholarship at Montana Tech to support students majoring in mining engineering or metallurgical and materials engineering. South Dakota Mines Center for Alumni Relations and Advancement Royal Gold has a $30,000 annual scholarship at South Dakota Mines that support students majoring in mining engineering. Colorado School of Mines Foundation The Royal Gold Scholarship was established at the Colorado School of Mines in 2022 to provide financial aid to enrolled undergraduate students pursuing a degree in mining engineering. Total annual funding for this scholarship is $25,000. Royal Gold is continuing to explore potential expanded scholarship opportunities with the Colorado School of Mines. INTRODUCTION ABOUT ROYAL GOLD GOVERNANCE OUR PEOPLE OPERATORS AND COMMUNITIES INVESTMENT STEWARDSHIP APPENDICES Royal Gold | 2025-2026 Investment Stewardship Report 53 CAYLA MARSHALL, INDUSTRIAL MAINTENANCE STUDENT AT GREAT BASIN COLLEGE “Growing up in Maine, I watched my grandfather build and fix things, which was an impactful experience. Over time, I realized I wanted a career where I could something similar: working with my hands, solving problems, and creating things. When I moved to Nevada in 2024, I saw it as the perfect opportunity to find a path in the mining industry. That’s when I found the Industrial Maintenance program at Great Basin College. I enjoy learning how things operate, troubleshooting challenges, and constantly building new skills. My goal is to grow in this field and eventually become an instructor, where I can help inspire more girls and women to pursue careers in a traditionally male- dominated industry. Representation matters—and I want to be part of showing that women can not only succeed in these roles, but lead in them.” CHARLIE WALLIS, MINING ENGINEERING STUDENT AT COLORADO SCHOOL OF MINES “At CSM, I have embraced being a part of the mining community, and what has stood out most is how inclusive and supportive everyone is. People are genuinely excited to share what they know about mining and help others grow. I am a member of the Mine Rescue Team and the Mines Mining Team. In five years, I see myself working as a mining engineer, gaining hands-on experience under the guidance of highly respected professionals in the field. I want to be involved in surface mining operations, developing my understanding of public relations, safety standards, and environmental regulations. I plan to contribute meaningfully to every project I'm part of, applying the skills and knowledge I've built at Mines while continuing to grow as an engineer.”
BAYLEY ANDERSON, MINING ENGINEERING STUDENT AT SOUTH DAKOTA SCHOOL OF MINES Bayley Anderson, an undergraduate student at the South Dakota School of Mines, was awarded the 2025 Royal Gold Academic Scholarship. Bayley is pursuing a bachelor’s degree in Mining Engineering and a certificate in Explosives Engineering. Upon graduation, Bayley plans to build a career in the mining industry, with the goal of making mining more environmentally sustainable and cost-effective. CASEY VANDERVEEN, ELECTRICAL SYSTEMS STUDENT AT GREAT BASIN COLLEGE “I grew up in Winnemucca, Nevada, where I developed an early appreciation for hard work and the industries, which includes mining, that support our local communities. I have a special appreciation for mining since mining has supported my family for generations. I was drawn to mining because of its critical role in providing the raw materials that modern society depends on, as well as the opportunity to work in a hands-on, technically challenging field. Currently, I am pursuing my education through a hybrid electrical program at GBC, where I continue to build my technical knowledge while gaining practical experience. The flexibility of the hybrid program allows me to work full time while attending school full time, giving me the opportunity to support myself financially while furthering my education.” NATALIE HAGERTY, MINING ENGINEERING STUDENT AT UNIVERSITY OF NEVADA “I am a mining engineering student at the University of Nevada, Reno, and my interest in mining comes from a long-standing curiosity about minerals and how resources are responsibly developed. As I have continued on with my studies, I’ve enjoyed learning not only the technical side of mining but also the importance of safety, teamwork, and environmental responsibility. I try to balance my coursework with involvement outside the classroom, including being an officer in the Women in Mining Club and gaining hands-on experience through an industry internship, both of which have helped me grow professionally and personally. These experiences have taught me the value of asking questions, staying organized, and learning from others. As I continue my education, I am motivated to keep building my skills and contribute in a thoughtful and positive way to the mining industry.” EMILY MCCALLA, MINING ENGINEERING STUDENT AT MONTANA TECHNOLOGICAL UNIVERSITY Emily McCalla is a Mining Engineering student at Montana Technological University and a 2025 recipient of the Royal Gold Scholarship. Emily has distinguished herself through her academic achievement, hands-on industry experience, and campus leadership. She is currently interning with Sandfire Resources at the Black Butte Copper Project and previously worked as an underground miner with Groundhog Mining & Milling Company, contributing to rehabilitation efforts at the World Museum of Mining's historic underground workings. In addition to pursuing a minor in Mineral Processing, Emily serves as President of the Montana Tech Geology Club, an active member of Women In Mining, competes as a student-athlete on the university's track and field team, and participates on Montana Tech's Intercollegiate Mining Team. The Royal Gold Scholarship is helping support Emily's educational journey as she develops the technical expertise, leadership skills, and practical experience needed to make a meaningful contribution to the future of the mining industry. INTRODUCTION ABOUT ROYAL GOLD GOVERNANCE OUR PEOPLE OPERATORS AND COMMUNITIES INVESTMENT STEWARDSHIP APPENDICES Royal Gold | 2025-2026 Investment Stewardship Report 54
Investment Stewardship One of our key investment principles is understanding the environmental and social risks, opportunities and impacts of the stream and royalty interests we hold. Our disciplined, deliberate approach to investment stewardship reflects our business model and the level of influence and relationships we have with the Operators of our stream and royalty interests. IN THIS SECTION 56 Climate Change 61 Operator Performance 63 Human Rights 72 Safety 73 Biodiversity 75 Operator Tailings Management 76 Legal Matters INTRODUCTION ABOUT ROYAL GOLD GOVERNANCE OUR PEOPLE OPERATORS AND COMMUNITIES INVESTMENT STEWARDSHIP APPENDICES Royal Gold | 2025-2026 Investment Stewardship Report 55
Climate Change Our Approach Climate change has the potential to transform the planet, the way we live and the way we conduct business. We recognize the expectations of our stakeholders in understanding how the climate can impact our business and how our activities have direct and indirect potential to impact climate over the short, medium and long terms. Our business makes passive investments in mining operations. We recognize that mining activities are inherently energy-intensive and that our interests facilitate mining operations that contribute to GHG emissions. Our approach to climate risk continues to be informed by three fundamental principles: (1) understanding potential physical and transition risk associated with a changing climate, (2) investigating actions and strategies that may be appropriate to reduce those risks and (3) monitoring energy, emissions, emissions reduction plans and accomplishments of our metal stream and royalty Operators and disclosing our findings. Our Climate Report discusses our approach to identifying, assessing and managing climate-related risks and opportunities. Royal Gold remains committed to understanding how both the physical impacts of climate change and the transition to a low-carbon economy might affect our business and how integrating these factors into our strategic planning can help reduce the impacts. ROYAL GOLD OPERATOR FOOTPRINT CALCULATION METHODOLOGY OVERVIEW Royal Gold uses the attribution factor “net gold equivalent ounce (GEO) production” for its weighted greenhouse gas (GHG) emissions, energy consumption and water consumption from each property in which we hold a stream or royalty interest. This allows us to compare royalty and stream interests on an equivalent basis. The methodology is used to determine the environmental footprint that can be attributed to our beneficial interests in properties. Our Operators’ GHG emission and energy and water consumption estimates were compiled by Skarn Associates, an independent mining sustainability data analytics firm. We rely on Skarn Associates’ database for energy, emissions and water consumption information for gold and copper mining operations. Currently, there is no consistent standard for calculating a net GEO for the industry. A detailed description of our methodology is on page 136 of this report. ROYAL GOLD GHG EMISSIONS DEFINITIONS Scope 1 emissions: Emissions from sources that Royal Gold owns or controls directly. Royal Gold has no scope 1 emissions. Scope 2 emissions: Emissions that Royal Gold causes indirectly from the energy we purchase and use. Scope 3 emissions: Royal Gold segments scope 3 emissions into two categories: scope 3 corporate emissions and scope 3 investment emissions. We do this because as a passive investor, we do not have direct influence or control over the Operators’ emissions, but we do manage and assert more control over our own direct footprint. • Scope 3 corporate emissions: Emissions arising from our direct corporate activities, primarily relating to business travel and employee commuting. • Scope 3 investment emissions: Scopes 1 and 2 emissions arising from our portfolio Operators. INTRODUCTION ABOUT ROYAL GOLD GOVERNANCE OUR PEOPLE OPERATORS AND COMMUNITIES INVESTMENT STEWARDSHIP APPENDICES Royal Gold | 2025-2026 Investment Stewardship Report 56
Corporate Emissions GHG emissions stem from direct fuel combustion (scope 1) and purchasing electricity externally (scope 2) as well as activities indirectly influenced by the reporting organization throughout its value chain (scope 3). This report categorizes scope 3 emissions into those originating from our organization’s corporate operations and those of its Operators (scope 3 investment emissions). This segmentation allows us to address our own footprint as a passive investor more effectively, given our limited control over Operators’ emissions. Further details on Operators’ emissions are in the “Operator GHG emissions” section. Our organization’s 39 employees are based in offices in the United States, Switzerland and Canada, with minimal direct environmental impact. We actively support and incentivize the use of public transportation for daily commuting by subsidizing these options. Additionally, our hybrid office model contributes to a significant reduction in both in-office emissions and those related to daily commuting. The tables on the right detail our corporate energy consumption and scope 2 and 3 corporate emissions, which include employee travel and employee commuting. We have no corporate scope 1 emissions. Our scope 2 and 3 corporate emissions have increased primarily due to the additional employees added to the team in 2025 coupled with the travel associated with the increased business activity in 2025. In Vancouver, 90% of our corporate energy use is supplied from renewable, clean energy sources, mainly from hydroelectric generation. ROYAL GOLD CORPORATE SCOPE 2 GHG EMISSIONS 1, 4 (tCO 2 e) 78 76 83 86.9 78 79.2 3 3 3 3.5 3 5 4.5 81 79 86 90.4 81 89 2020 2021 2022 2023 2024 2025 0 20 40 60 80 100 a Total 🟇 Denver, Colorado 🟇 Toronto, Ontario 🟇 Lucerne, Switzerland 🟇 Vancouver, Canada ROYAL GOLD CORPORATE SCOPE 3 GHG EMISSIONS 2,3, 4 (tCO 2 e) 68 43 300 415 393 682 2020 2021 2022 2023 2024 2025 0 100 200 300 400 500 600 700 a Total 🟇 Employee business travel 🟇 Employee commuting ROYAL GOLD CORPORATE TOTAL SCOPE 2 AND 3 GHG EMISSIONS (tCO 2 e) 149 122 386 505 475 771 2020 2021 2022 2023 2024 2025 0 100 200 300 400 500 600 700 800 900 ROYAL GOLD CORPORATE ENERGY CONSUMPTION (MWh) Estimated indirect grid electricity purchased (market-based) 316 275 300 267 247 250 258 58 5 5 5 5 5 5 200 101 97 86 4 97 10 100 169 165 168 138 145 156 100 0 2020 2021 2022 2023 2024 2025 a Total 🟇 Denver, 🟇 Toronto, 🟇 Lucerne, 🟇 Vancouver, Colorado Ontario Switzerland Canada 1. Our scope 2 corporate emissions are calculated internally. Royal Gold uses emissions factors from government sources and the Greenhouse Gas Protocol’s GHG Emissions Calculations Tool to determine scope 2 corporate emissions. 2. Our scope 3 corporate emission calculations includes private and commercial airline business travel emissions. Commercial airline emissions are provided by a third party, Egencia. Our employee commuting emissions and private airline emissions are calculated internally. Egencia uses emissions factors from the United Kingdom’s Department for Environment, Food and Rural Affairs. Our scope 3 corporate emissions cover 100% of all Royal Gold employees. 3. Emissions in 2020 and 2021 are low due to limited travel during COVID. 4. We update emission factors and recalculate emissions yearly. This process consists of reviewing data sources for recent publications, bringing newly published emission factors into our emission factor dataset, and recalculating entries to adopt the most recent emission factors where appropriate. 5. All data associated with our Vancouver office only accounts for November and December 2025 as the Sandstorm acquisition closed at the end of October 2025. INTRODUCTION ABOUT ROYAL GOLD GOVERNANCE OUR PEOPLE OPERATORS AND COMMUNITIES INVESTMENT STEWARDSHIP APPENDICES Royal Gold | 2025-2026 Investment Stewardship Report 57
Offsetting Our Corporate Emissions Since 2020, we have acquired verified carbon credits to offset scope 2 and 3 corporate emissions that we otherwise have been unable to eliminate, thus achieving carbon neutrality for our corporate operations. We are committed to achieving carbon neutrality for our corporate operations, annually. We continue to purchase verified carbon credits through Anew Climate, LLC, a leading climate solutions company that offers environmentally focused products, services and investments that support decarbonization, including the sale of verified carbon credits. For the past three years, Royal Gold sourced carbon credits from the GreenTrees Reforestation Project in Arkansas, U.S. GreenTrees Reforestation Project GreenTrees is reforesting one million acres of marginal farmland in the Mississippi Alluvial Valley. To date, GreenTrees has planted more than 42 million trees on 120,000 acres in partnership with private landowners. The tree plantings have generated millions of tons of verified carbon credits that are registered on the American Carbon Registry (ACR). These credits account for the vast majority of domestic forestry credits registered on the voluntary market. In recognition of its vision in building toward a 1,000,000-acre goal, the ACR awarded GreenTrees the Innovation Award in April of 2018. GreenTrees has delivered and/or retired millions of tonnes of carbon offsets to corporations and municipalities, including Duke Energy, Norfolk Southern and the Arbor Day Foundation. Technology and mechanism Reforestation: Replanting trees in a previously forested area Mechanism: Removal Durability: 40+ years. The durability of this project is 40 years, based on its crediting period. However, the project is designed to have incentives to keep project lands permanently in forest. Project details Emissions reduced or carbon removed annually: 526,702 tonnes Project certifications Certifier: ACR Standard: American Carbon Registry Registry ID : ACR114 SDG Alignment: INTRODUCTION ABOUT ROYAL GOLD GOVERNANCE OUR PEOPLE OPERATORS AND COMMUNITIES INVESTMENT STEWARDSHIP APPENDICES Royal Gold | 2025-2026 Investment Stewardship Report 58 GreenTrees Reforestation Project, Mississippi Alluvial Valley
Organization Resilience to Climate Change Impacts The mining sector is highly expose to both physical and transition climate risks. These risks can directly impact the profitability, regulatory compliance, operational efficiency and reputational standing of mining operations. Financial resilience is critical to our ability to absorb shock from climate impacts that are experience by the operations where we hold stream and royalty interests. Our organization’s climate change resilience is a function of the characteristics of our portfolio, our actions to diligence additions to the portfolio and actions of the Operators of the properties in our portfolio. Our Portfolio Resilience We assess the resilience of our business through our stream and royalty interests. The indicators by which we assess out portfolio’s financial resilience to potential impacts from climate-related risks include: • Geographic and asset diversification • Commodity diversification • GHG emissions intensity (individual asset and portfolio) • Distribution of GEO production subject to carbon taxation • Jurisdictional water stress • Operator commitment to address climate change Production Subject to Carbon Tax Mine site economic impacts associated with the application of a carbon tax can be significant, so operations where a carbon tax is already being applied have less transition risk, as the cost associated with carbon taxation is likely already included in economic modeling and mine planning. Three jurisdictions where we have stream or royalty interest impose some level of direct carbon taxation. Although Mexico and Chile impose modest carbon taxes on operations that generated about 15% of our revenue in 2025, Canada imposes the most significant tax, which varies by province but applies to about 33% of our 2025 revenue. INTRODUCTION ABOUT ROYAL GOLD GOVERNANCE OUR PEOPLE OPERATORS AND COMMUNITIES INVESTMENT STEWARDSHIP APPENDICES Royal Gold | 2025-2026 Investment Stewardship Report 59 Quisqueya power plant, Dominican Republic
Operator Commitment to Climate Change Our climate resilience is closely linked to the performance of the Operator and how they address climate change at their operations. We observe that 90% of our 2025 revenue was generated from assets where the operating company has initiated climate disclosure with reference to the TCFD framework. We look at the statistic as indicating a high degree of climate risk awareness. 60% of 2025 revenue is associated with operating companies that have set emissions reduction targets to be achieved by 2030 or sooner, and 52% of our revenue is associated with companies that have made formal commitments toward achieving net zero GHG emissions by 2050. Teck Resources, Barrick and Newmont continuously update their comprehensive actions and plans to reduce emissions at the operations they manage. These three Operators generated about 36% of our revenue in 2024, while their operations generated about 57% of the scope 1 and scope 2 emissions attributed to our stream and royalty interests. These same operators have completed the most impactful emission reduction projects or have disclosed plans for reduction projects prior to 2030. Operator Percentage of 2025 Royal Gold Revenue Year Climate Scenario Analysis Target Status ‘15 ‘20 ‘25 ‘30 ‘35 ‘40 ‘45 ‘50 ‘55 ‘60 Barrick Gold Corporation 12.9% 🟇 No 2025 15% absolute reduction target achieved Centerra Gold Inc. 21.8% Yes Chifeng Jilong Gold Mining Co. Ltd. 5.0% 🟇 🟇 Unknown Ero Copper 2.9% Yes First Quantum 3.1% Yes KGHM International Ltd. 1.8% 🟇 Yes Kinross Gold Corporation 2.1% 🟇 Yes 1-2% annualized reductions achieved MMG Limited 4.5% 🟇 Yes Nevada Gold Mines LLC 7.7% 🟇 Yes 2025 15% absolute reduction target achieved New Gold Inc. (now Coeur Mining) 6.9% Yes Newmont Corporation 6.8% 🟇 Yes Teck Resources Limited 7.6% 🟇 Yes 83.1% Operators of our Principal Properties and those that contributed at least 1.5% of our revenue in 2025 are presented in the graph above with their emissions reduction commitments, as reported in their public disclosures. Scope 1&2 Intensity Scope 1&2 Absolute Scope 3 Absolute 🟇 Carbon Neutral (S1 & 2) 🟇 Net Zero (S1, 2) 🟇 Net Zero Ambition 🟇 Carbon Peak 30% 30% 30% 35% 33% 32% 15% 50% 1-2% 30% 15% 30% 50% 32% 30% INTRODUCTION ABOUT ROYAL GOLD GOVERNANCE OUR PEOPLE OPERATORS AND COMMUNITIES INVESTMENT STEWARDSHIP APPENDICES Royal Gold | 2025-2026 Investment Stewardship Report 60
Operator Performance Investment stewardship means continually maintaining an understanding of the stream and royalty interests we hold with respect to production, operational and ESG performance, among other considerations. Understanding the performance of Operators and properties in which we hold stream and royalty interests begins with collecting information through a monitoring process. This process supports the systematic reporting of relevant information to senior management and the Board. We obtain monitoring data and other information via contractual rights, from the Operators’ public disclosures and from third-party data sources. Operators’ annual sustainability reports and websites are also important sources of data that are reviewed extensively to compile views on Operator performance across a wide range of subjects. We have prepared a more in-depth look at how we assess the performance of the Operators of our stream and royalty interests with respect to both ethical and human rights performance in this year’s review, which we feel supports the quality of the Operators within our portfolio of interests. We also review our portfolio performance with respect to energy consumption, GHG emission generation, water consumption and associated consumption intensities over the period 2018 through 2024. Finally, reviews and analysis are provided on safety performance, tailings management and biodiversity as applied to our portfolio. INTRODUCTION ABOUT ROYAL GOLD GOVERNANCE OUR PEOPLE OPERATORS AND COMMUNITIES INVESTMENT STEWARDSHIP APPENDICES Royal Gold | 2025-2026 Investment Stewardship Report 61 Khoemacau site visit, 2025
Portfolio Snapshot ASSET AND GEOGRAPHIC DIVERSIFICATION We had more than 80 assets providing revenue, as of December 31, 2025. In 2025, our largest revenue-generating asset was Mount Milligan in Central British Columbia, which generated 22% of our 2025 revenue. All jurisdictions are subject to physical climate risks, and our geographic diversification ensures that acute climate risk events are not likely to impact multiple sites; additionally, no single chronic risk condition is likely to impact multiple jurisdictions within a select timeframe. REVENUE BY JURISDICTION 3.2% 3.9% 7.4% 32.6% 14.4% 7.6% 12.7% 13.6% 4.6% 🟇 Canada 🟇 United States 🟇 Dominican Republic 🟇 Africa 🟇 Mexico 🟇 Chile 🟇 Australia 🟇 Brazil 🟇 Other REVENUE BY MINE TYPE 3.0% 12.0% 7.0% 78.0% 🟇 Gold 🟇 Copper 🟇 Silver 🟇 Other COMMODITY DIVERSIFICATION Our revenue is heavily weighted toward gold and silver. Primary gold mines generated 78% of our revenue in 2025; primary copper mines or mines with significant copper revenue generated 7% of our revenue; and primary base metal mines other than copper mines generated 12% of our silver revenue. In an economy focused on energy transformation from fossil fuels, the need for copper, a critical energy transition metal, should increase support for current and future copper mines. According to the International Energy Agency's latest Global Critical Minerals Outlook, copper demand associated with clean energy increases in all climate scenarios by roughly 150% to more than 350% by 2050, depending on the scenario. We see the metal mix in our portfolio supporting portfolio resilience with respect to transition risks. OPERATOR GHG EMISSION INTENSITY (SCOPE 1 AND SCOPE 2) Our scope 3 investment emissions in 2024 had a weighted average GHG emission intensity of 0.84 tCO 2 e/ Net GEO (i.e., tonnes of CO 2 equivalent per net GEO), which shows a fairly consistent trend over the seven-year period of 2018 through 2024. Analysis of our portfolio’s energy consumption and associated GHG emissions shows that the emissions intensity of the energy associated with our attributable stream and royalty interests has a strong improvement trend with time. However, as these figures are weighted by production, a shift in our revenue or the underlying production from an operation with low emissions to one with high emissions may change our portfolio’s characteristics. DISTRIBUTION OF REVENUE IN WATER STRESS JURISDICTIONS We rely on assessments of water stress published by the Water Resources Institute’s Aqueduct™ Water Risk Atlas. Baseline water stress measures the ratio of total water demand to available renewable surface and groundwater supplies. Water demand includes domestic, industrial, irrigation and livestock uses. Available renewable water supplies include the impact of upstream consumptive water users and large dams on downstream water availability. Higher values indicate more competition among users. In 2025, 20% of our revenue was produced from water basins with water stress classifications of High or Extremely High, while 15% of our revenue was generated from areas classified as Arid/Low water usage. The revenue associated with High, Extremely High and Arid/Low water usage has been relatively constant over the last five years. REVENUE BY BASELINE WATER STRESS INTRODUCTION ABOUT ROYAL GOLD GOVERNANCE OUR PEOPLE OPERATORS AND COMMUNITIES INVESTMENT STEWARDSHIP APPENDICES Royal Gold | 2025-2026 Investment Stewardship Report 62 50.8% 13.9% 2.4% 17.7% 0.0% 15.2% 🟇 Low 🟇 Medium-High 🟇 Extremely High 🟇 Low-Medium 🟇 High 🟇 Arid/Low Water
Human Rights Human rights are basic standards aimed at securing dignity and equality for all people. Royal Gold is committed to respecting internationally recognized human rights standards. Royal Gold endorses the ICMM Mining Principles and the WGC RGMPs, each of which incorporates the United Nations Guiding Principles on Business and Human Rights, among other related standards. Royal Gold regularly reviews the Operators’ human rights and child labor disclosures. We also consider operator performance towards the United Nations Children’s Fund (UNICEF) Children’s Rights in the Workplace Index Score along with the RepRisk child labor monitoring and due diligence activities. We also regularly review our regulatory reporting obligations with respect to human rights and child labor and will file the appropriate disclosures when required. Our Royal Gold Human Rights Policy provides a framework to ensure that human rights are respected in all Company operations. Royal Gold believes that human rights are basic standards aimed to secure dignity and equality for all people. Royal Gold is committed to respecting internationally recognized human rights standards. 97% 1 of the Operators have human rights policies or statements referring to an international standard. 93% 1 of the Operators have Modern Slavery Reports or Statements. Human rights are basic standards aimed at securing dignity and equality for all people. Royal Gold is committed to respecting internationally recognized human rights standards, as stated in our Human Rights Policy. Our Standards for Suppliers and Operators outline our expectations regarding standards of conduct expected from suppliers and Operators that conduct business with us. When selecting new interests or undertaking other relationships with suppliers and Operators, we consider whether potential suppliers and Operators hold values and promote practices that, as applicable, align with our Standards. We seek to build mutually beneficial working relationships with suppliers and Operators and intend to show preference for those suppliers and Operators that demonstrate alignment with our Standards. Suppliers are expected to comply with the laws of the jurisdictions in which they operate, including, but not limited to, those concerning health and safety, human rights, the environment, bribery and corruption, securities, and taxes. Suppliers are also expected to respect internationally recognized principles of human rights, including those set forth in our Human Rights Policy prohibiting child labor, forced labor, and human trafficking. When considering new acquisitions or monitoring our existing portfolio of stream and royalty interests, we evaluate an Operator’s business practices, approaches and values, including whether an Operator respects internationally recognized human rights, including those relating to child labor, human trafficking, slavery, and forced labor and avoids complicity in human rights violations by third parties, and complies with applicable labor protection laws related to collective bargaining, forced labor, child labor, and discrimination. However, as passive interest holders, our ability to monitor project operations and influence an Operator’s decision making is determined by the contract that governs our stream or royalty interest, and our contractual rights are often quite limited and we might not be in a position to influence or monitor project operations. As part of our efforts to fulfill our commitment to respect human rights in connection with our stream and royalty interests, we draw upon a wide variety of policies, practices and disclosures of our stream and royalty partners, which we evaluate during due diligence and routine performance monitoring of our portfolio. Royal Gold regularly reviews Operator human rights and child labor disclosures. We also reference recognized third-party data sources to assess human rights risks with jurisdictions where we operate, which include: • UNICEF Children’s Rights in the Workplace Index Score. • The Global Slavery Index, published by Walk Free. • RepRisk , one of our ESG data providers, identifies risks and incidents of human rights and child labor that are publicly reported and assessed by jurisdiction, industry and company. Regulatory disclosure requirements concerning modern slavery are increasing and offer a more systematic, focused look at how a company considers such in their business. • Canadian Fighting Against Forced Labour and Child Labour in Supply Chains Act (S.C. 2023) requires applicable companies to report on specific actions taken to help prevent and reduce forced labor. • Australian Modern Slavery Act (2018) requires large businesses and other entities operating in Australia with a turnover of more than $100 million AUD to report annually on the actions they have taken to address modern slavery risks in their operations and supply chains. • The UK Modern Slavery Act 2015 is the principal UK legislation addressing slavery, forced labor, and human trafficking, and—through its Section 54 "Transparency in Supply Chains" provision— requires commercial organizations carrying on business in the UK with an annual turnover of £36 million or more to publish an annual statement describing the steps taken to ensure modern slavery is not occurring in their operations or supply chains. Our Principal Properties’ performance on human rights metrics is presented in the following table, along with performance of our portfolio of revenue- generating interest. 1. Percent is based on revenue generated by companies in our 2025 portfolio. INTRODUCTION ABOUT ROYAL GOLD GOVERNANCE OUR PEOPLE OPERATORS AND COMMUNITIES INVESTMENT STEWARDSHIP APPENDICES Royal Gold | 2025-2026 Investment Stewardship Report 63
MODERN SLAVERY The concept of modern slavery covers a set of specific legal concepts, including forced labor, debt bondage, forced marriage, slavery and slavery-like practices, and human trafficking. Although modern slavery is not defined in law, it is used as an umbrella term that focuses attention on commonalities across these legal concepts. Modern slavery typically refers to situations of exploitation that a person cannot refuse or leave because of threats, violence, coercion, deception and/or abuse of power. CONFLICT-FREE GOLD STANDARD The Conflict-Free Gold Standard is designed to be implemented by World Gold Council member companies and other entities involved in the extraction of gold. It was developed to establish a common approach by which gold producers can assess and provide assurance that their gold has been extracted in a manner that does not cause, support or benefit unlawful armed conflict or contribute to serious human rights abuses or breaches of international humanitarian law. CHILDREN’S RIGHTS IN THE WORKPLACE INDEX The Children’s Rights in the Workplace Index, developed by UNICEF, is a benchmarking tool to evaluate and guide businesses on their responsibility toward children's rights in their operations and supply chains. The index defines three levels of recommended due diligence for each country based on the level of risk related to children's rights. These levels guide businesses in determining the depth of policies and practices required to address potential impacts on children in different regions. • Basic Due Diligence (Low-Risk Countries) • Enhanced Due Diligence (Medium-Risk Countries) • Heightened Due Diligence (High-Risk Countries) PRINCIPAL PROPERTIES - HUMAN RIGHTS METRICS Policies/Standards/Disclosures Andacollo Cortez Mount Milligan Pueblo Viejo Kansanshi Operators Teck Resources Limited Nevada Gold Mines LLC Centerra Gold Inc. Barrick Gold Corporation First Quantum Minerals Ltd. Policies/Standards Human Rights Policy Yes Yes Yes Yes Yes Child labor inclusion in Human Rights Policy Yes Yes Yes Yes Yes International Standards Voluntary Principles on Security and Human Rights Adopted Adopted Adopted Adopted Adopted Prior and Informed Consent of Indigenous Peoples Aligned Aligned Aligned Aligned Aligned United Nations Guiding Principles on Business and Human Rights Aligned Aligned Aligned Adopted Adopted International Labour Organization Declaration of Fundamental Principles and Rights at Work Aligned Aligned Unknown Aligned Aligned Disclosures Conflict-Free Gold Standard N/A Adopted and Verified Adopted and Verified Adopted and Verified N/A Modern Slavery Report Report Report Report Report Report Human Rights Risk Assessment Process Yes Yes Yes Yes Yes INTRODUCTION ABOUT ROYAL GOLD GOVERNANCE OUR PEOPLE OPERATORS AND COMMUNITIES INVESTMENT STEWARDSHIP APPENDICES Royal Gold | 2025-2026 Investment Stewardship Report 64
Modern Slavery and Child Labor GLOBAL SLAVERY INDEX - VULNERABILITY • Published by Walk Free. • Measures the extent to which a population is vulnerable to modern slavery across 160 countries. • The index is based on a scale of 100, with a high score indicating higher vulnerability. UNICEF CHILDREN’S RIGHTS IN THE WORKPLACE INDEX Due Diligence Response Level: • Basic • Enhanced • Heightened Legend Country (RGLD 2025 % Revenue) Global Slavery Index: Vulnerability Score UNICEF: Due Diligence Response Level Global Slavery Index: Vulnerability Low High UNITED STATES 14.4% REV 25 INDEX Enhanced DDRL MEXICO 7.4% REV 58 INDEX Enhanced DDRL DOMINICAN REPUBLIC 12.7% REV 41 INDEX Enhanced DDRL BRAZIL 3.2% REV 47 INDEX Enhanced DDRL GHANA 5.0% REV 45 INDEX Enhanced DDRL BOTSWANA 4.5% REV 45 INDEX Enhanced DDRL AUSTRALIA 3.9% REV 7 INDEX Basic DDRL CHILE 7.6% REV 22 INDEX Basic DDRL ZAMBIA 3.1% REV 58 INDEX Enhanced DDRL CANADA 32.6% REV 11 INDEX Basic DDRL INTRODUCTION ABOUT ROYAL GOLD GOVERNANCE OUR PEOPLE OPERATORS AND COMMUNITIES INVESTMENT STEWARDSHIP APPENDICES Royal Gold | 2025-2026 Investment Stewardship Report 65
Energy Consumption, GHG Emissions and Our Portfolio We track the energy consumption associated with our portfolio of revenue-generating assets as useful metrics to assess ongoing performance and drivers behind GHG emissions. Generally, as the processing of ore on-site increases, energy use also increases. As mines become deeper and cover more area, more energy is required for activities such as mine ventilation and dewatering, and more energy and fuel are needed to haul ore and waste rock over greater vertical and horizontal distances. Mines with lower ore grades or more complex processing can also show increased energy intensity. We collect and assess direct and indirect energy consumption and usage intensity (i.e., gigajoules per GEO and kilowatt hours per tonne of ore processed). This allows us to understand the operational efficiency attributed to our stream and royalty interests, to benchmark our portfolio performance, to better understand operator scope 1 and scope 2 GHG emission generation, and to evaluate risks and opportunities associated with our investment portfolio. RELATIONSHIPS BETWEEN ENERGY CONSUMPTION AND GHG EMISSIONS Direct Energy Site-Generated Power Fuel Consumed x Fuel Emissions Factor Scope 1 Emissions Non-Power Generation Ore and Waste Moved Diesel Fuel Consumption x Diesel Fuel Emissions Factor Other Fuels Consumed at Mine Site x Fuel Emissions Factor (i.e., heating fuels, small vehicle operation) Fugitive Emissions (i.e., gases from blasting operations and certain ore processing operation) Indirect Energy Grid-Supplied Power Power Consumption x Percentage of Power Purchased x Grid Factor Scope 2 Emissions INTRODUCTION ABOUT ROYAL GOLD GOVERNANCE OUR PEOPLE OPERATORS AND COMMUNITIES INVESTMENT STEWARDSHIP APPENDICES Royal Gold | 2025-2026 Investment Stewardship Report 66 Xavantina mine, Brazil
Operator Energy Consumption Total energy (direct 1 + indirect 2 ) intensity per GEO shows a declining trend from 2021 through 2024. We integrate energy and emissions data of mining operations developed by Skarn Associates. As part of our energy compilation efforts, we also have tracked the emissions associated with each unit of both direct and indirect energy consumed (emissions factors). The emissions factors associated with both direct and indirect energy have trended downward for the past six years but increased in 2024. The total energy emissions factor change was (19%) for the seven-year period. The improvement in overall direct and indirect energy consumption is a positive indicator of the Operators making changes in their mines to improve energy efficiency and reduce GHG emissions. Our portfolio overall direct and indirect energy consumption has consistently decreased since 2021. This decrease, as mentioned in previous reports, is largely attributed to Teck Resources’ Andacollo mine in Chile. The Andacollo mine entered into a long-term contract to purchase 100% renewable energy, which has significantly reduced emissions. DIRECT AND INDIRECT ENERGY CONSUMPTION (GIGA JOULE) 2,990 3,240 3,429 3,976 3,537 3,057 2,864 2018 2019 2020 2021 2022 2023 2024 — 500 1,000 1,500 2,000 2,500 3,000 3,500 4,000 4,500 a Total 🟇 Direct 🟇 Indirect DIRECT AND INDIRECT ENERGY INTENSITY (GIGA JOULE/NET GOLD EQUIVALENT OUNCE) 11.5 12.1 12.8 14.0 13.4 11.8 11.0 2018 2019 2020 2021 2022 2023 2024 0 3 6 9 12 15 a Total 🟇 Direct 🟇 Indirect DIRECT AND INDIRECT ENERGY EMISSIONS FACTOR 55 55 51 70 70 62 57 2018 2019 2020 2021 2022 2023 2024 0 10 20 30 40 50 60 70 80 a Total 🟇 Direct 🟇 Indirect 1. Direct energy: the energy produced and consumed by the Operator within its operations, projects and facilities; it may include energy from fuels, sunlight, wind, water, etc. and is used to run the Operator’s equipment and vehicles and to produce power and heat on-site. 2. Indirect energy: electricity, thermal or other energy sources provided by a retail provider or facility not owned or operated by the user of the energy. INTRODUCTION ABOUT ROYAL GOLD GOVERNANCE OUR PEOPLE OPERATORS AND COMMUNITIES INVESTMENT STEWARDSHIP APPENDICES Royal Gold | 2025-2026 Investment Stewardship Report 67
Operator GHG Emissions We report scope 1 and scope 2 GHG emissions from our stream and royalty interests that generate revenue for Royal Gold, which we refer to as our scope 3 investment emissions. We have been able to track Operator scope 1 and scope 2 emissions estimates for approximately 98% of the net GEOs generated in the seven-year period from 2018 through 2024. The Appendix details our revenue-generating assets and their associated GHG emissions data, as compiled by Skarn Associates. We have weighted the emissions intensity from each stream and royalty interest, based on the net GEOs we receive as a proportion of the total GEOs produced by each asset, to determine our scope 3 investment emissions. A more detailed description of the asset-weighting process to estimate portfolio intensity is included in the Appendix. Understanding the GHG emission performance of individual assets and our portfolio of stream and royalty interests is a fundamental building block in our climate scenario analysis and an important factor in assessing our resilience to transition risks associated with climate change. GHG emissions at a mine site are driven by the amount of diesel fuel and electrical energy consumed by the operation, the fuel sources used to generate grid power and the type of ore processing, among other factors. The GHG emissions connected to our portfolio are dominated by Operator scope 1 emissions, which are associated with using fossil fuels to power mobile equipment and in some cases generate power. Scope 1 emissions comprised approximately 75% of the total scope 1 and 2 investment emissions from the calendar year 2024. Since 2018, approximately 39% of Scope 1 emissions is associated with site power generation. Operator GHG Emission Intensity We define GHG emission intensity as the tonnes of scope 1 and scope 2 CO 2 (equivalent) emissions per net GEO produced. The average emission intensity of the Operators for the revenue-generating portion of our stream and royalty portfolio is shown in the figure to the right. Using a GHG intensity measurement as a KPI allows us to track performance over time, regardless of changes in the annual production attributable to our stream and royalty interests. Attributed emissions rose approximately 10%, from 197 to 217 ktCO ₂ e, while attributable GEOs were essentially flat. Roughly two-thirds of the increase was operational, which included mines purchasing more grid power, higher site emissions at several operations, and three new mines entering the portfolio. About one-third of the increase is a result of reflecting methodology changes, chiefly grid emission-factor re-ratings and a larger estimate for non-reporting properties. 217,000 tonnes CO 2 e 2024 scope 1 and 2 (scope 3 investment emissions) 13.5% Power Generation Scope 2 25% 28% Other Emissions/Fuel 33.5% Vehicle Diesel Scope 1 SCOPE 1 AND 2 GHG EMISSIONS ESTIMATES (tCO 2 e, Net GEOs) 210,000 227,000 211,000 218,000 196,000 197,000 217,000 2018 2019 2020 2021 2022 2023 2024 0 50,000 100,000 150,000 200,000 250,000 300,000 🟇 Scope 1 🟇 Scope 2 a Scope 1 and 2 GEO Production SCOPE 1 AND 2 GHG EMISSIONS INTENSITY (tCO 2 e)/Net Gold Equivalent Ounces 0.81 0.85 0.79 0.77 0.74 0.76 0.84 2018 2019 2020 2021 2022 2023 2024 0.0 0.2 0.4 0.6 0.8 1.0 🟇 Scope 1 🟇 Scope 2 a Scope 1 and 2 INTRODUCTION ABOUT ROYAL GOLD GOVERNANCE OUR PEOPLE OPERATORS AND COMMUNITIES INVESTMENT STEWARDSHIP APPENDICES Royal Gold | 2025-2026 Investment Stewardship Report 68
Water Risk, Consumption and Our Portfolio Operator Water Availability and Risk Mining and ore processing operations require significant amounts of water. Water sourcing and consumption can be prominent concerns for local communities and established water users, and unique water supply and management strategies are often used at mining operations to allow production while addressing local environmental and social concerns. Many of the opportunities we evaluate are in areas of elevated water stress, which require in- depth reviews of the Operators’ water management plans, including stakeholders’ concerns. In our due diligence for new opportunities, we review the project water balance, the sustainability of water supply sources and the potential for water competition with other users in the region. We routinely benchmark the actual or estimated water consumption performance of a project against similar operations. Ongoing monitoring of water availability and risk is required to understand if there is a change in risk exposure from the period when our initial due diligence was conducted. We collect water consumption data to understand water use intensity and also consult external sources that assess water-related risks. These data collection activities also support our efforts to understand how climate risks could impact our stream and royalty interests. WATER CONSUMPTION INTENSITY (kLiters)/Net GEO (kLiters)/t ore processed 22 21 22 25 25 26 2019 2020 2021 2022 2023 2024 0 10 20 30 40 0.0 0.3 0.6 0.9 1.2 🟇 Intensity (kL/Net GEO) Intensity (kL/t ore processed) Operator Water Consumption Intensity We track water consumption intensity as a useful metric to assess performance of production from our portfolio of stream and royalty interests. Water consumption intensity is measured as cubic meters of water consumed per net GEO produced or tonne of ore processed by each operation. Using an intensity measurement as a KPI allows us to track changes over time, and it remains relevant regardless of changes in annual production. The Appendix details our revenue-generating mineral properties for the 2019–2024 period and their associated water consumption estimates, as compiled by Skarn Associates. In many cases, when mining companies disclose water data, the volume of reported withdrawn water does not represent the total water used in the operation. Not all rainwater, runoff, dewatering and other flows are completely captured and disclosed in the reported water balance indicators. As a result, there is a potential to underreport water consumption or reuse efficiencies, and we rely on Skarn Associates to provide a systematic view of water consumption, which in many cases requires estimation. Water consumption intensity on a net GEO basis has increased by about 21% over the six-year period from 2019 through 2024, while water consumption per tonne of ore processed was flat during the same period. The Skarn water database allows us to benchmark the attributed production from our stream and royalty interests and shows that water consumption intensity per net GEO benchmarks in the fourth quartile of produced gold, while water consumption intensity per tonne of ore processed benchmarks in the second quartile. We interpret this as meaning that the Operators of the properties generating our revenue are generally efficient at managing water usage at their sites, as evidenced by the low water intensity per tonne of ore treated, while the higher water consumption intensity per net GEO indicates that the metal production per tonne is lower than the industry average. INTRODUCTION ABOUT ROYAL GOLD GOVERNANCE OUR PEOPLE OPERATORS AND COMMUNITIES INVESTMENT STEWARDSHIP APPENDICES Royal Gold | 2025-2026 Investment Stewardship Report 69 Mine safety training center, Platreef site visit, 2025
Operator Water Risk Water-related risks are one of the parameters we use to assess climate-related risks and potential impacts on our stream and royalty interests as we advance our TCFD climate scenario analysis. We aim to understand the water-related risks to our interests, communicate those risks to our stakeholders and engage with the Operators when we seek to better understand site- specific issues. Our Approach Our stream and royalty interests are geographically and climatologically diverse. We strive to systematically understand the risk in our portfolio associated with water supply and to independently and effectively communicate our findings to stakeholders. We based this assessment of our portfolio of stream and royalty interests on a global water risk mapping tool, Aqueduct™ Water Risk Atlas, developed by the World Resource Institute. The atlas is based on a framework of eight physical water risk indicators: water stress, water depletion, interannual variability, seasonal variability, groundwater table decline, riverine flood risk, coastal flood risk and drought risk. We have focused on three risk indicators — water stress, interannual variability and drought risk — as these directly correlate to our Principal Properties having sufficient water to operate or potentially receiving excess precipitation. An assessment of the three water risk indicators for our full portfolio is presented in the graphs. Approximately 35% of our revenue in 2025 was associated with jurisdictions classified as having Extremely High or High water stress or being classified as Arid/Low water use, which has modestly increase over the last seven years. Inter- annual variability also has an increasing trend with time, and about 34% of our 2025 revenue was produced from jurisdictions with either Extremely High or High designations. With respect to drought risk, none of our 2025 revenue was produced from a jurisdiction classified as High or greater, but 39% of the net GEOs were produced from jurisdictions with Medium or Medium-High drought risk. Drought risk has had a significant and steady decreasing trend from 2018, when an estimated 48% of our portfolio production came from areas with a drought risk classified as Medium or higher. BASELINE WATER STRESS 15.2% Arid/Low Water 17.7% Extremely High 2.4% High 50.8% Low 13.9% Low-Medium 0% Medium-High INTERANNUAL VARIABILITY 22.9% Extremely High 1% Low 11.5% High 61.1% Low-Medium 3.0% Medium-High DROUGHT RISK 0% High 14.1% Medium- High 25.3% Medium 1.5% Not Reported 25.7% Low 33.4% Low-Medium Aqueduct™ Indicators provide estimates of the stated indicators of water risk with a resolution of approximately 10 km x 10 km. 1 Baseline Water Stress measures the ratio of total water withdrawals to available renewable surface and groundwater supplies. Water withdrawals include domestic, industrial, irrigation and livestock consumptive and non-consumptive uses. Available renewable water supplies include the impact of upstream consumptive water users and large dams on downstream water availability. Higher values indicate more competition among users. Interannual Variability measures the average between year variability of available water supply, including both renewable surface and groundwater supplies. Higher values indicate wider variations in available supply from year to year. Drought Risk measures where droughts are likely to occur, the population and assets exposed, and the vulnerability of the population and assets to adverse effects. Higher values indicate higher risk of drought. 1. Kuzma, S., M.F.P. Bierkens, S. Lakshman, T. Luo, L. Saccoccia, E. H. Sutanudjaja, and R. Van Beek. 2023. “Aqueduct 4.0: Updated decision-relevant global water risk indicators.” Technical Note. Washington, D.C.: World Resources Institute. Available online at: doi.org/10.46830/ writn.23.00061. INTRODUCTION ABOUT ROYAL GOLD GOVERNANCE OUR PEOPLE OPERATORS AND COMMUNITIES INVESTMENT STEWARDSHIP APPENDICES Royal Gold | 2025-2026 Investment Stewardship Report 70
OUR WATER SOURCE AND EXPOSURE TO WATER STRESS, AS DEFINED BY AQUEDUCT Water source Surface water Ground water Precipitation and runoff Water stress Abundant Scarcity Reuse and recycling rate Extreme Medium High to High Low Moderate to Moderate Low Arid/Low Water Use MOUNT MILLIGAN Canada NEVADA GOLD MINES USA PUEBLO VIEJO Dominican Republic ANDACOLLO Chile KANSANSHI Zambia Water Stress Water Stress Water Stress Water Stress Water Stress Interannual Variability Interannual Variability Interannual Variability Interannual Variability Interannual Variability Drought Risk Drought Risk Drought Risk Drought Risk Drought Risk INTRODUCTION ABOUT ROYAL GOLD GOVERNANCE OUR PEOPLE OPERATORS AND COMMUNITIES INVESTMENT STEWARDSHIP APPENDICES Royal Gold | 2025-2026 Investment Stewardship Report 71
Safety We are committed, alongside Operators of our stream and royalty interests, to prioritizing the health and safety of workers, families and local communities. Approximately 92% of our 2024 revenue was generated from sites that disclosed a Health and Safety policy. We use two metrics to track the performance of our portfolio of revenue-generating stream and royalty interests: the Total Recordable Incident Frequency Rate (TRIFR) and the number of fatal accidents. TRIFR is the number of fatalities, lost-time injuries, substitute work and other injuries requiring treatment by a medical professional per million hours worked. A compilation of 2020-2024 TRIFR statistics from Operators is shown in the chart below. A comparative benchmarking was completed using TRIFRs published by the ICMM, based on an average X billion work hours per year, which show a downward trend year over year. Our portfolio weighted average TRIFR performance increased in 2024 compared to the prior year. This increase was not indicative of a broad-based deterioration in safety performance across our operations; rather, it was driven by a small number of isolated, site-specific incidents at a few operations. These events were distinct in nature and circumstance, reflecting localized operational factors rather than a systemic or portfolio-wide trend, and, taken together, they were sufficient to move the aggregate frequency rate upward for the year. Unfortunately, we regret to report that in 2024 Xavantina mine in Brazil, Dolores mine in Mexico and Rainy River in Canada each experienced a fatal accident. One fatality was experienced at Goldrush mine in Nevada in 2025. Mine simulator, Platreef site visit, 2025 TOTAL REPORTABLE INCIDENT FREQUENCY RATE 1,2 3.1 3.6 2.9 2.88 4.4 2020 2021 2022 2023 2024 0.0 1.0 2.0 3.0 4.0 5.0 🟇 Royal Gold Portfolio ICMM 1. TRIFR per 1,000,000 work hours is weighted by work hours. 2. Represents data that is compiled by the ICMM from its members and is publicly reported. INTRODUCTION ABOUT ROYAL GOLD GOVERNANCE OUR PEOPLE OPERATORS AND COMMUNITIES INVESTMENT STEWARDSHIP APPENDICES Royal Gold | 2025-2026 Investment Stewardship Report 72 Mount Milligan site visit, 2025
Biodiversity Royal Gold is committed to systematically reporting biodiversity metrics across our stream and royalty portfolio. Our monitoring identifies elevated levels of risk and enhances our due diligence efforts. Importance of Biodiversity By endorsing the ICMM Mining Principles, Royal Gold recognizes Principle 7: Conservation of Biodiversity. As a streaming and royalty company, we continue to look for ways to contribute to the conservation of biodiversity. We continue to use the Integrated Biodiversity Assessment Tool (IBAT) to monitor our portfolio and when considering new opportunities. In addition to using the IBAT global biodiversity dataset, Royal Gold also reviews the IUCN Red List of Threatened Species, the World Database on Protected Areas and the World Database of Key Biodiversity Areas (KBAs). The chart on the following page shows the proximity of our Principal Properties to any KBAs, including any identified International Union for Conservation of Nature species within a 10-km radius of the point selected to represent the operation’s position and the corresponding IBAT Rarity Weighted Richness score. In 2025, the number of species listed as Critically Endangered increased by one at Andacollo and the number of species listed as Endangered increased by three at Pueblo Viejo and two at Andacollo. The increases can be attributed to improved monitoring and reporting practices. Royal Gold references the IFC Performance Standards on Social and Environmental Sustainability, which includes Performance Standard 6 on Biodiversity Conservation, as a comprehensive biodiversity resource, especially when a project is located in an IFC designated country and/or when applicable. The WGC RGMPs also details specific biodiversity criteria used by Royal Gold. Royal Gold uses adherence to these biodiversity- related standards as a benchmark when evaluating operators' environmental and social commitments during due diligence and portfolio monitoring. We also regularly engage biodiversity specialists to assist in our due diligence efforts. INTRODUCTION ABOUT ROYAL GOLD GOVERNANCE OUR PEOPLE OPERATORS AND COMMUNITIES INVESTMENT STEWARDSHIP APPENDICES Royal Gold | 2025-2026 Investment Stewardship Report 73 Approximately 97% of our 2025 revenue was produced from sites that disclosed a Biodiversity Policy and/or operating protocols related to biodiversity management. Elephant watering hole, maintained by Khoemacau mine, site visit 2025
Project Located With Designated Protected Area Project Located With KBA IUCN Red List Species (January 2026) IBAT Rarity-Weighted Richness Property Name Name of Area Name of Area Critically Endangered Endangered Vulnerable Near Threatened Least Concern Data Deficient Mount Milligan None None 0 1 14 20 327 2 Medium Pueblo Viejo Aniana Vargas National Park None 8 25 38 47 612 8 High Andacollo None Quisco Coquimbano 5 12 37 39 507 29 High Cortez None None 0 2 16 17 399 0 Medium Kansanshi None None 9 12 15 30 1,286 24 Medium The rarity-weighted richness map is a raster layer showing the relative importance of each ~10 km grid cell in terms of its aggregate contribution to the global distribution of species of mammals, birds, amphibians, crabs, crayfishes and shrimps. The rarity-weighted richness for each species within a grid cell was calculated as the contribution of the cell toward the global distribution of the species. These scores were summed across all species present within a grid cell to give an overall score. High values show that a cell holds a large number of species and/or that the average ranges of the species present in the cell are small so that the cell represents a relatively high proportion of their range. Loss of species’ populations in such cells is therefore of disproportionate significance in terms of loss of global biodiversity (at least for the taxonomic groups considered). Rarity-weighted richness is also known as “range-size rarity” or “range rarity” and has been used as a metric of biodiversity significance as well as feeding into the Biodiversity Impact Metric. INTRODUCTION ABOUT ROYAL GOLD GOVERNANCE OUR PEOPLE OPERATORS AND COMMUNITIES INVESTMENT STEWARDSHIP APPENDICES Royal Gold | 2025-2026 Investment Stewardship Report 74
Operator Tailings Management The safety of people and neighboring communities and the protection of the environment are top priorities. Concerns about tailings and waste products from mining and ore processing underscore the importance of proper management and storage to ensure chemical and physical stability and meeting public safety and regulatory standards. TSF, Khoemacau site visit, 2025 Our Approach As part of our due diligence with respect to new business opportunities, we identify potential risks associated with tailings storage, including reviews of a site’s seismic, hydrological and geotechnical characterization; the design of facilities used to store waste; management monitoring plans for the storage facilities; and emergency planning in the event of a facility failure. We typically enlist geotechnical expertise to assess each site’s unique conditions, comparing facility designs and operations against international guidelines such as the Canadian Dam Association and the Global Industry Standard on Tailings Management. This evaluation helps us gauge how Operators handle this critical aspect of their projects. In some cases, our due diligence reveals substandard tailing storage practices, leading us to discontinue the pursuit of those opportunities. In August 2020, the first global standard for tailings management, the Global Industry Standard on Tailings Management (GISTM), was jointly established by the International Council on Mining and Metals (ICMM), the United Nations Environment Programme, and the Principles for Responsible Investment. The standard sets a high benchmark for improving the safe management of tailings storage facilities and underpins the shared objective of achieving zero harm to people and the environment. In 2025, all five Operators of our Principal Properties disclosed details of their tailings storage facilities and operating practices, and we estimate that properties generating 95% of revenue provide some level of disclosure on their tailings storage facilities. Given the heightened public profile associated with tailings storage, we have provided links on our website to the tailings management disclosures presented by our stream and royalty Operators. We actively maintain a comparative assessment of all the tailings facilities in our portfolio using publically available information. The assessment ranks both the physical and environmental characteristics of the facilities and the level of internal and external oversight. PRINCIPAL PROPERTIES - TAILINGS MANAGEMENT Policies/Standards/ Disclosures Andacollo Cortez Mount Milligan Pueblo Viejo Kansanshi Operators Teck Resources Limited Nevada Gold Mines LLC Centerra Gold Inc. Barrick Gold Corporation First Quantum Minerals Ltd. Policies/Standards Tailings Management Policy Tailings Management Standard Sustainable Development Policy Tailings Management Standard Safety and Security of our Tailings Storage Facilities International Standards GISTM GISTM Canadian Dam Association (CDA) GISTM GISTM GRI GRI GRI Australian National Commission on Large Dams ICMM ICMM International Commission on Large Dams ICMM Mining Association of Canada Tailings Protocol CDA International Commission on Large Dams Disclosures 2025 Storage Facility GISTM Disclosure Report 2025 Storage Facility GISTM Disclosure Report 2025 Sustainability Report 2025 Storage Facility GISTM Disclosure Report 2025 Environmental, Social and Governance Report INTRODUCTION ABOUT ROYAL GOLD GOVERNANCE OUR PEOPLE OPERATORS AND COMMUNITIES INVESTMENT STEWARDSHIP APPENDICES Royal Gold | 2025-2026 Investment Stewardship Report 75
Legal Matters Cautionary Note Regarding Forward-Looking Statements This report includes “forward-looking statements” within the meaning of U.S. federal securities laws. Forward-looking statements are any statements other than statements of historical fact. Forward-looking statements are not guarantees of future performance, and actual results may differ materially from these statements. Forward-looking statements are often identified by words like “will,” “may,” “could,” “should,” “would,” “believe,” “estimate,” “expect,” “anticipate,” “plan,” “forecast,” “potential,” “intend,” “continue,” “project,” or negatives of these words or similar expressions. Forward-looking statements include, among others, statements regarding the following: the potential effects of climate change and related regulation on us or the Operators or their projects; actions we or the Operators may take in response to climate change and related regulation; the benefits of the various efforts described in this report, including, among others, those relating to sustainability, health and safety; our expected financial performance and outlook; Operators’ expected operating and financial performance and other anticipated developments relating to their properties and operations, including production, deliveries, environmental and feasibility studies, technical reports, mine plans, capital requirements, liquidity, and capital expenditures; opportunities for investments, acquisitions and other transactions, and the process and criteria we use in evaluating such opportunities; anticipated benefits from investments, acquisitions and other transactions; anticipated liquidity, capital resources, financing, and stockholder returns; borrowings and repayments under our revolving credit facility; the materiality of properties within our portfolio; macroeconomic and market conditions; and prices for gold, silver, copper, and other metals. Factors that could cause actual results to differ materially from these forward-looking statements include, among others, the following: environmental risks, including those caused by climate change; changes in laws or regulations governing us, Operators, or their properties, including actions taken by governments and other entities and groups to mitigate climate change and in response to climate change; contractual issues involving our stream or royalty agreements, including those as a result of climate change; future exploration and development activities by Operators; our ability to identify, finance, value and complete investments, acquisitions, or other transactions; increased competition for stream and royalty interests; changes in the price of gold, silver, copper, or other metals; operating activities or financial performance of properties on which we hold stream or royalty interests, including variations between actual and forecasted performance, Operators’ ability to complete projects on schedule and as planned, Operators’ changes to mine plans and mineral reserves and mineral resources (including updated mineral reserve and mineral resource information), liquidity needs, mining and environmental hazards, labor disputes, distribution and supply chain disruptions, permitting and licensing issues, other adverse government or court actions or operational disruptions; changes of control of properties or Operators; potential cyber-attacks, including ransomware; adverse economic and market conditions; effects of health epidemics and pandemics; changes in management and key employees; and other factors described in our most recent Annual Report on Form 10-K, including under the caption Risk Factors, and in our other filings with the SEC. Most of these factors are beyond our ability to predict or control. Other unpredictable or unknown factors not discussed in this report could also have material adverse effects on forward-looking statements. Forward-looking statements speak only as of the date on which they are made. We disclaim any obligation to update any forward-looking statements, except as required by law. Readers are cautioned not to put undue reliance on forward-looking statements. Statement Regarding Materiality This report discloses the Company’s GHG emissions, the GHG emissions associated with properties on which the Company holds stream or royalty interests and certain scenario analyses, transition plans and activities the Company or Operators may take to mitigate or adapt to climate change. While the Company believes that it is prudent to consider climate-related risks and the potential effects of climate change on the Company, the Company does not consider its GHG emissions or any scenario analyses, transition plans or activities the Company or Operators may take to mitigate or adapt to climate change to be material to the Company’s business, strategy, results of operations or financial condition, in light of the time horizons involved and the currently anticipated magnitude of the impact to the Company’s business, strategy, results of operations or financial condition of climate change. Statement Regarding Third-Party Information The disclosures in this report relating to properties and operations on the properties in which we hold stream or royalty interests are based in most cases on information publicly disclosed by the Operators of these properties and information available in the public domain, and in some cases on information provide to us by consultants or other third-party sources. We do not independently prepare or verify information provided by consultants or other third-party sources or the information publicly disclosed by or provided directly to us by the Operators, and, as the holder of stream and royalty interests, we do not have access to the properties or operations or to sufficient data to do so. There can be no assurance that such third-party information is complete or accurate. INTRODUCTION ABOUT ROYAL GOLD GOVERNANCE OUR PEOPLE OPERATORS AND COMMUNITIES INVESTMENT STEWARDSHIP APPENDICES Royal Gold | 2025-2026 Investment Stewardship Report 76
Appendices 78 Corporate Performance 79 Principal Property Performance 82 Operator Production Performance 92 Operator Energy Consumption 102 Portfolio Energy Intensity Summary 104 Operator GHG Emissions 116 Operator Water Consumption 127 Operator Stewardship Framework Alignment 129 GRI Index 133 TCFD Index 134 SDG Index 135 Glossary 136 GHG Emissions Footprint Calculation Methodology INTRODUCTION ABOUT ROYAL GOLD GOVERNANCE OUR PEOPLE OPERATORS AND COMMUNITIES INVESTMENT STEWARDSHIP APPENDICES Royal Gold | 2025-2026 Investment Stewardship Report 77
Corporate Performance 2020 2021 2022 2023 2024 2025 Employee Statistics Total Number of Employees 29 31 30 30 29 39 Total Employee Turnover 3 1 1 0 2 0 % of Employee Turnover 7% 3% 3% 0 7% 0 ESG External Ratings CSA S&P Sustainability Score (scale 0-100, 100 is best) NR 21 34 31 36 36 Sustainalytics (scale 0-40+, lower score is better) 22.8 18.7 9.1 9.7 10.9 12.3 MSCI (AAA is best, CCC is least) A AA AA AA AA AA ISS ESG Corporate Rating (A+ is best, D- is least) C- C- C- C- C- C (Prime) ISS – Governance Score (scale 1-10, lower score is better) 2 1 1 1 1 1 ISS – Environment Score (scale 1-10, lower score is better) 10 10 8 8 8 6 ISS – Social Score (scale 1-10, lower score is better) 7 8 6 7 6 6 Safe Operation TRIFR 0 0 0 0 0 0 Energy and Climate Change Corporate Scope 2 GHG Emissions (tCO 2 e) 81 79 86 90 81 89 Corporate Scope 3 GHG Emissions (tCO 2 e) 68 43 300 415 393 682 Corporate Total Scope 2 and 3 GHG Emissions (tCO 2 e) 149 122 386 505 475 771 Corporate Energy Consumption (MWh) 247 250 258 275 267 316 Community Engagement Community Investments ($US) $1,016,000 $1,014,000 $1,105,000 $1,241,000 $1,488,932 $1,564,955 Governance Political Contributions 0 0 0 0 0 0 Whistleblower Complaints 0 0 0 0 0 0 Memberships and Industry Association Payments NR NR NR $115,718 $138,021 $190,728 INTRODUCTION ABOUT ROYAL GOLD GOVERNANCE OUR PEOPLE OPERATORS AND COMMUNITIES INVESTMENT STEWARDSHIP APPENDICES Royal Gold | 2025-2026 Investment Stewardship Report 78
Principal Property Performance Mount Milligan Pueblo Viejo Cortez Andacollo Kansanshi 2025 Revenue Percentage 22% 13% 7% 8% 3% Jurisdiction and Company RepRisk ESG reputational risk rating - country Low High Moderate Moderate Very High RepRisk ESG reputational risk rating - company Low High Low Low Moderate Corruption Perception Index quartile ranking 1st Quartile 3rd Quartile 1st Quartile 1st Quartile 3rd Quartile Energy and Climate Corporate emission reduction targets publicly reported No Yes Yes Yes No GHG emissions intensity (tCO 2 e/GEO) quartile ranking 1 1st 4th 2nd 1st NA Total energy intensity (GJ/GEO) quartile ranking 1 4th 4th 3rd 4th NA Water Water stress rating by Aqueduct Water Risk Atlas Low Low-Medium Extremely High Extremely High N/A Water consumption intensity (m 3 /GEO) quartile ranking 1 4th 4th 1st 4th N/A Water consumption Intensity (m 3 /t ore processed) quartile ranking 1 1st 4th 1st 2nd N/A Biodiversity IUCN Red List species (critically endangered + endangered) 1 33 2 17 21 Designated protected area or KBAs covering all or part of project’s active footprint None Aniana Vargas National Park None Quisco Coquimbano None Safe Operation Number of fatal accidents in 2025 0 0 1 0 0 Tailing management disclosure Yes Yes Yes Yes Yes Workforce and Communities Human rights policy Yes Yes Yes Yes Yes Modern slavery disclosure Report Report Report Report Report Grievance mechanism Yes Yes Yes Yes Yes 1. Based on Skarn Associates Gold Industry ranking curves for 2024 2. An “N/A” indicates that 2024 data associated with Kansanshi is not reported as the asset was not part of the Royal Gold portfolio. We expect to fully report detailed data for Kansanshi in next year’s report. INTRODUCTION ABOUT ROYAL GOLD GOVERNANCE OUR PEOPLE OPERATORS AND COMMUNITIES INVESTMENT STEWARDSHIP APPENDICES Royal Gold | 2025-2026 Investment Stewardship Report 79
Portfolio Performance Scorecard 1,2,3 Parameter Gold Industry 4 2019 2020 2021 2022 2023 2024 2024 Average Revenue ($ million) $468 $562 $654 $603 $606 $719 Net Gold Equivalent Ounces (GEO) Sold 5,6 268,000 268,000 284,000 265,000 259,000 260,000 Energy and Climate Change 6 GHG Emission (tCO 2 e) 227,000 211,000 218,000 196,000 197,000 217,000 Scope 1 and 2 GHG Emissions Intensity (tCO 2 e/GEO) 0.85 0.79 0.77 0.74 0.76 0.84 0.78 Total Energy Intensity (GJ/GEO) 12.1 12.8 14.0 13.4 11.8 11.0 8.9 Energy Emissions Factor (tCO 2 e/TJ) 70 62 55 55 51 57 77 Process Electrical Energy Intensity (kW-hr/t processed) 40.4 39.9 40.5 40.9 36.0 35.1 31.9 Percentage of Electrical Energy from Grid 72% 69% 68% 71% 76% 85% 82% Grid Factor (tCO 2 e/MWh) 0.22 0.18 0.12 0.14 0.12 0.16 0.32 Diesel Fuel Intensity (liters/t mined) 1.15 1.02 1.09 1.07 0.80 0.83 Percentage of Portfolio Revenue Production With Absolute GHG Emissions Reduction Target(s) by 2030 55% 57% 60% Percentage of Portfolio Revenue Production With Net Zero GHG Emission Target by 2050 47% 51% 52% Water Availability 7 Water Consumption Intensity (m 3 /Net GEO) 21.7 21.4 21.7 24.8 25.0 26.2 21.1 Water Consumption Intensity (m 3 /t ore treated) 0.57 0.53 0.51 0.60 0.56 0.6 0.59 Percentage of Revenue From High or Extremely High Water Stress Regions 8 39% 40% 44% 40% 45% 45% Percentage of Revenue From Regions With High or Extremely High Interannual Precipitation Variability 34% 32% 35% 37% 43% 43% INTRODUCTION ABOUT ROYAL GOLD GOVERNANCE OUR PEOPLE OPERATORS AND COMMUNITIES INVESTMENT STEWARDSHIP APPENDICES Royal Gold | 2025-2026 Investment Stewardship Report 80
Safe Operations TRIFR NR 3.1 3.6 2.9 2.9 4.4 2.3 Number of Fatal Accidents NR 2 2 6 0 3 Percentage of Applicable Revenue Covered by Tailing Disclosure NR 90% 85% 89% 95% Percentage of Applicable Revenue That Are Signatories to the International Cyanide Management Code NR 76% 71% 68% 68% 1. The Company changed its fiscal year end from June 30 to December 31, effective as of December 31, 2021. Accordingly, certain amounts in this table have been adjusted to reflect unaudited calendar year information. 2. Metrics are weighted average using net GEOs. 3. We use the most current data available and adjust our calculations accordingly. None of the changes made to past data are material. 4. Energy and GHG emissions industry average statistics are based on data provided by Skarn Associates for 2024, and industry average safety statistics were obtained from the ICMM for 2024. 5. GEO production is estimated based on the following metal prices for each year using production units identified by Skarn Associates: $1,758/oz Au; $20.54/oz Ag; $6,185.82/lb Cu; $1,826.14/lb Pb; $2,268.85/lb Zn. 6. Net GEO production data may be updated for minor errors and inconsistencies identified in prior years. 7. Energy, GHG emissions and water data used to estimate portfolio performance was provided by Skarn Associates. Some data is estimated by Skarn, and Skarn may update prior year estimates. 8. Also includes jurisdictions classified as Arid and Low water use. INTRODUCTION ABOUT ROYAL GOLD GOVERNANCE OUR PEOPLE OPERATORS AND COMMUNITIES INVESTMENT STEWARDSHIP APPENDICES 81 | 2025-2026 Investment Stewardship Report Royal Gold
Operator Production Performance The following table presents production performance data for a majority of our revenue-generating mineral properties, as available from Skarn Associates, an independent mining sustainability data analytics firm, for calendar years 2019 through 2024. Net GEOs are from Royal Gold’s production records and are determined in accordance with the methodology on page 56 . Entries labeled “NR” means the data was not reported in the Skarn Associates and those labeled “–” are for periods when Royal Gold did not have royalty or stream revenue from the mineral property. Skarn Associates may update prior year information, which we may have presented in prior reports. We use the most current data available from Skarn Associates and adjust our presentation of data and calculations accordingly. The Operator Production Performance table does not include assets from the Sandstorm/Horizon or Kansanshi transactions as these were not in our portfolio during 2024. Mineral Property/Operator Year 1 Royal Gold Net GEOs 2 (%) Royal Gold Attributable 2 (GEO) Ore Processed 4 (kt) Reported Production 4,5 (kGEO) RGLD % of Site Reported GEO Production 6 Principal Properties Andacollo 2019 17.2% 46,041 16,987 233 19.8% Teck Resources Limited 2020 13.4% 35,785 19,811 247 14.5% 2021 11.4% 32,454 18,621 190 17.1% 2022 8.4% 22,194 17,199 162 13.7% 2023 8.4% 21,696 16,323 159 13.7% 2024 6.5% 17,006 14,355 157 10.9% Cortez 3 2019 4.3% 11,551 22,025 963 1.2% Nevada Gold Mines LLC 2020 6.1% 16,353 21,169 798 2.0% 2021 11.0% 31,165 29,208 731 4.3% 2022 10.6% 28,085 14,783 869 3.2% 2023 18.8% 48,683 25,595 893 5.5% 2024 11.3% 29,249 10,753 722 4.1% Mount Milligan 2019 23.3% 62,325 16,350 312 20.0% Centerra Gold Inc. 2020 24.8% 66,521 20,067 310 21.4% 2021 23.5% 66,779 20,900 327 20.4% 2022 27.0% 71,347 21,348 317 22.5% 2023 23.5% 61,040 21,680 266 23.0% 2024 24.3% 63,028 21,463 262 24.0% INTRODUCTION ABOUT ROYAL GOLD GOVERNANCE OUR PEOPLE OPERATORS AND COMMUNITIES INVESTMENT STEWARDSHIP APPENDICES Royal Gold | 2025-2026 Investment Stewardship Report 82
Mineral Property/Operator Year 1 Royal Gold Net GEOs 2 (%) Royal Gold Attributable 2 (GEO) Ore Processed 4 (kt) Reported Production 4,5 (kGEO) RGLD % of Site Reported GEO Production 6 Pueblo Viejo Barrick Gold Corporation 2019 17.3% 46,353 8,607 1,046 4.4% 2020 16.9% 45,246 8,828 960 4.7% 2021 14.1% 40,191 9,110 866 4.6% 2022 12.4% 32,937 9,448 768 4.3% 2023 10.6% 27,577 8,887 596 4.6% 2024 9.6% 24,810 9,550 625 4.0% Non-Principal Properties Allan/Borax Nutrien Ltd. 2019 0.3% 701 NR NR NR 2020 0.3% 743 NR NR NR 2021 0.3% 746 NR NR NR 2022 0.3% 713 NR NR NR 2023 0.3% 718 NR NR NR 2024 0.3% 701 NR NR NR Bald Mountain 3 Kinross Gold Corporation 2019 0.2% 589 16,475 188 0.3% 2020 0.0% 83 18,303 191 0.0% 2021 0.2% 491 19,063 205 0.2% 2022 0.4% 1,014 15,924 214 0.5% 2023 0.3% 874 17,306 158 0.6% 2024 0.1% 260 18,392 181 0.1% Bellevue Bellevue Gold Ltd. 2019 0.0% 0.0% NR NR 0.0% 2020 0.0% 0.0% NR NR 0.0% 2021 0.0% 0.0% NR NR 0.0% 2022 0.0% 0.0% NR NR 0.0% 2023 0.0% 0.0% NR NR 0.0% 2024 1.1 % 2,915 NR NR NR INTRODUCTION ABOUT ROYAL GOLD GOVERNANCE OUR PEOPLE OPERATORS AND COMMUNITIES INVESTMENT STEWARDSHIP APPENDICES Royal Gold | 2025-2026 Investment Stewardship Report 83
Mineral Property/Operator Year 1 Royal Gold Net GEOs 2 (%) Royal Gold Attributable 2 (GEO) Ore Processed 4 (kt) Reported Production 4,5 (kGEO) RGLD % of Site Reported GEO Production 6 Canadian Malartic 3 Agnico Eagle Mines Ltd. 2019 1.8% 4,833 21,049 679 0.7% 2020 1.6% 4,373 20,506 569 0.8% 2021 1.5% 4,178 22,260 722 0.6% 2022 1.0% 2,597 19,540 665 0.4% 2023 0.3% 758 19,697 701 0.1% 2024 0.1% 252 20,317 659 0.0% Celtic/Wonder North Northern Star Resources Ltd. 2019 0.0% 0.0% NR NR 0.0% 2020 0.0% 0.0% NR NR 0.0% 2021 0.0% 0.0% NR NR 0.0% 2022 0.0% 0.0% NR NR 0.0% 2023 0.0% 0.0% NR NR 0.0% 2024 0.1% 307 NR NR NR Côté IAMGOLD Corporation 2019 — — — — — 2020 — — — — — 2021 — — — — — 2022 0.0% 0.0% NR NR 0.0% 2023 0.0% 0.0% NR NR 0.0% 2024 0.5% 1,229 4,948 200 0.6% Dolores Pan American Silver Corporation 2019 1.9% 5,037 6,777 177 2.8% 2020 1.5% 4,048 6,430 142 2.8% 2021 2.0% 5,658 7,774 186 3.0% 2022 1.9% 5,089 7,957 163 3.1% 2023 1.6% 4,093 7,617 133 3.1% 2024 1.1% 2,824 7,251 92 3.1% INTRODUCTION ABOUT ROYAL GOLD GOVERNANCE OUR PEOPLE OPERATORS AND COMMUNITIES INVESTMENT STEWARDSHIP APPENDICES Royal Gold | 2025-2026 Investment Stewardship Report 84
Mineral Property/Operator Year 1 Royal Gold Net GEOs 2 (%) Royal Gold Attributable 2 (GEO) Ore Processed 4 (kt) Reported Production 4,5 (kGEO) RGLD % of Site Reported GEO Production 6 Don Nicolas 3 Cerrado Gold, Inc. 2019 0.0% 0.0 NR NR 0.0% 2020 0.4% 1,141 333 17 6.7% 2021 0.2% 572 414 43 1.3% 2022 0.2% 638 395 54 1.2% 2023 0.1% 226 508 69 0.3% 2024 0.4% 1,098 1,886 55 2.0% El Limón Equinox Gold 2019 0.6% 1,739 482 63 2.8% 2020 0.9% 2,339 428 65 3.6% 2021 1.0% 2,705 496 68 4.0% 2022 1.2% 3,152 494 77 4.1% 2023 1.1% 2,728 508 72 3.8% 2024 1.2% 3,013 506 70 4.3% Goldstrike 3 Nevada Gold Mines LLC (Goldstrike and Carlin were combined by Nevada Gold Mines for reporting purposes starting in 2019 and are referred to as Carlin.) 2019 0.9% 2,422 16,044 1,720 0.1% 2020 0.7% 1,947 19,829 1,667 0.1% 2021 0.6% 1,680 23,223 1,502 0.1% 2022 0.7% 1,736 19,574 1,649 0.1% 2023 0.3% 813 11,798 1,411 0.1% 2024 0.3% 731 10,824 1,260 0.1% Granite Creek i-80 Gold Corp. 2019 0.0% 0.0% NR NR 0.0% 2020 0.0% 0.0% NR NR 0.0% 2021 0.0% 0.0% NR NR 0.0% 2022 0.0% 0.0% NR NR 0.0% 2023 0.0% 0.0% NR NR 0.0% 2024 0.2% 455 NR NR NR INTRODUCTION ABOUT ROYAL GOLD GOVERNANCE OUR PEOPLE OPERATORS AND COMMUNITIES INVESTMENT STEWARDSHIP APPENDICES Royal Gold | 2025-2026 Investment Stewardship Report 85
Mineral Property/Operator Year 1 Royal Gold Net GEOs 2 (%) Royal Gold Attributable 2 (GEO) Ore Processed 4 (kt) Reported Production 4,5 (kGEO) RGLD % of Site Reported GEO Production 6 Gwalia 3 Genesis Minerals Limited 2019 1.0% 2,784 659 184 1.5% 2020 0.9% 2,287 697 156 1.5% 2021 0.9% 2,587 998 188 1.4% 2022 0.8% 2,231 999 158 1.4% 2023 0.7% 1,920 1,000 180 1.1% 2024 0.7% 1,696 1,241 152 1.1% Khoemacau MMG Limited (formally Khoemacau Copper) 2019 —% — — — —% 2020 —% — — — —% 2021 0.7% 2,042 1,800 121 1.7% 2022 3.1% 8,290 3,600 228 3.6% 2023 5.4% 13,943 3,258 210 6.7% 2024 4.3% 11,180 3,039 151 7.4% King of the Hills Vault Minerals Limited 2019 0.4% 976 NR NR —% 2020 0.2% 486 NR NR NR 2021 0.0% 89 NR NR NR 2022 0.2% 510 2,364 70 NR 2023 0.8% 2,158 4,714 211 1.0% 2024 0.9% 2,235 5,137 201 1.1% LaRonde Zone 5 3 Agnico Eagle Mines Ltd. 2019 0.5% 1,321 2,927 436 0.3% 2020 0.4% 1,157 2,674 370 0.3% 2021 0.4% 1,207 2,961 403 0.3% 2022 0.6% 1,509 2,816 378 0.4% 2023 0.5% 1,271 2,658 326 0.4% 2024 0.6% 1,513 2,849 329 0.5% INTRODUCTION ABOUT ROYAL GOLD GOVERNANCE OUR PEOPLE OPERATORS AND COMMUNITIES INVESTMENT STEWARDSHIP APPENDICES Royal Gold | 2025-2026 Investment Stewardship Report 86
Mineral Property/Operator Year 1 Royal Gold Net GEOs 2 (%) Royal Gold Attributable 2 (GEO) Ore Processed 4 (kt) Reported Production 4,5 (kGEO) RGLD % of Site Reported GEO Production 6 Leeville (North) 3 (Scope 1 emissions included portions of emissions from the Western 102 and TS power plants.) Nevada Gold Mines LLC 2019 0.3% 848 16,044 1,720 0.0% 2020 0.3% 930 19,829 1,667 0.1% 2021 1.0% 2,949 23,223 1,502 0.2% 2022 0.9% 2,339 19,574 1,649 0.1% 2023 1.1% 2,953 11,798 1,411 0.2% 2024 1.3% 3,324 10,824 1,260 0.3% Manh Choh Kinross Gold Corporation 2019 0.0% 0.0% NR NR 0.0% 2020 0.0% 0.0% NR NR 0.0% 2021 0.0% 0.0% NR NR 0.0% 2022 0.0% 0.0% NR NR 0.0% 2023 0.0% 0.0% NR NR 0.0% 2024 1.7% 4,480 34,276 480 0.9% Mara Rosa Hochschild Mining plc 2019 0.0% 0.0% NR NR 0.0% 2020 0.0% 0.0% NR NR 0.0% 2021 0.0% 0.0% NR NR 0.0% 2022 0.0% 0.0% NR NR 0.0% 2023 0.0% 0.0% NR NR 0.0% 2024 0.7% 1,802 1,758 64 2.8% Marigold 3 SSR Mining Inc. 2019 1.5% 4,041 25,676 220 1.8% 2020 1.7% 4,630 23,556 234 2.0% 2021 1.6% 4,662 19,999 235 2.0% 2022 1.3% 3,387 21,818 230 1.5% 2023 1.0% 2,637 22,010 260 1.0% 2024 1.3% 3,388 27,690 168 2.0% INTRODUCTION ABOUT ROYAL GOLD GOVERNANCE OUR PEOPLE OPERATORS AND COMMUNITIES INVESTMENT STEWARDSHIP APPENDICES Royal Gold | 2025-2026 Investment Stewardship Report 87
Mineral Property/Operator Year 1 Royal Gold Net GEOs 2 (%) Royal Gold Attributable 2 (GEO) Ore Processed 4 (kt) Reported Production 4,5 (kGEO) RGLD % of Site Reported GEO Production 6 Meekathara 3 Westgold Resources Ltd. 2019 0.7% 1,989 2,319 173 1.1% 2020 0.8% 2,099 2,794 183 1.1% 2021 0.7% 1,973 2,998 190 1.0% 2022 0.6% 1,645 2,778 202 0.8% 2023 0.4% 1,101 2,200 177 0.6% 2024 0.1% 187 2,576 142 0.1% Peñasquito Newmont Corporation 2019 4.1% 10,874 19,964 660 1.6% 2020 7.1% 19,102 30,590 1,317 1.5% 2021 8.2% 23,305 35,720 1,509 1.5% 2022 7.6% 20,060 35,928 1,354 1.5% 2023 3.4% 8,707 20,850 589 1.5% 2024 7.7% 20,088 31,799 1,046 1.9% Rainy River Coeur Mining, Inc. 2019 5.5% 14,718 8,023 257 5.7% 2020 4.7% 12,623 8,819 233 5.4% 2021 5.2% 14,722 9,250 242 6.1% 2022 5.0% 13,150 8,602 235 5.6% 2023 5.8% 15,053 8,764 259 5.8% 2024 5.6% 14,533 8,990 228 6.4% Red Chris Newmont Corporation 2019 —% — — — —% 2020 —% — — — —% 2021 —% — — — —% 2022 0.5% 1,315 9,457 172 0.8% 2023 0.6% 1,471 9,267 133 1.1% 2024 0.4% 1,035 6,293 128 0.8% INTRODUCTION ABOUT ROYAL GOLD GOVERNANCE OUR PEOPLE OPERATORS AND COMMUNITIES INVESTMENT STEWARDSHIP APPENDICES Royal Gold | 2025-2026 Investment Stewardship Report 88
Mineral Property/Operator Year 1 Royal Gold Net GEOs 2 (%) Royal Gold Attributable 2 (GEO) Ore Processed 4 (kt) Reported Production 4,5 (kGEO) RGLD % of Site Reported GEO Production 6 Robinson KGHM International Ltd. 2019 1.9% 5,088 14,200 232 2.2% 2020 2.2% 5,986 14,000 195 3.1% 2021 1.8% 5,209 14,000 246 2.1% 2022 1.9% 5,058 14,000 210 2.4% 2023 1.5% 3,817 10,000 129 3.0% 2024 2.5% 6,490 14,000 231 2.8% Skyline Wolverine Fuels, LLC 2019 0.3% 775 NR NR NR 2020 0.3% 846 NR NR NR 2021 0.1% 212 NR NR NR 2022 0.0% 127 NR NR NR 2023 0.3% 739 NR NR NR 2024 0.3% 782 NR NR NR South Laverton 3 Northern Star Resources Ltd. 2019 1.1% 3,060 2,378 198 1.5% 2020 2.2% 5,975 2,690 213 2.8% 2021 1.9% 5,484 3,728 254 2.2% 2022 1.3% 3,437 3,717 195 1.8% 2023 1.4% 3,726 3,798 248 1.5% 2024 1.4% 3,761 3,887 251 1.5% Southern Cross Shandong Tianye Group 2019 0.4% 1,079 2,345 162 0.7% 2020 0.3% 898 2,345 162 0.6% 2021 0.3% 956 2,345 162 0.6% 2022 0.3% 758 2,345 162 0.5% 2023 0.3% 814 2,345 164 0.5% 2024 0.4% 993 2,345 164 0.6% INTRODUCTION ABOUT ROYAL GOLD GOVERNANCE OUR PEOPLE OPERATORS AND COMMUNITIES INVESTMENT STEWARDSHIP APPENDICES Royal Gold | 2025-2026 Investment Stewardship Report 89
Mineral Property/Operator Year 1 Royal Gold Net GEOs 2 (%) Royal Gold Attributable 2 (GEO) Ore Processed 4 (kt) Reported Production 4,5 (kGEO) RGLD % of Site Reported GEO Production 6 Voisey’s Bay Vale S.A. 2019 2.0% 5,327 2,116 390 1.4% 2020 1.5% 3,902 1,800 367 1.1% 2021 2.6% 7,393 2,061 398 1.9% 2022 1.5% 4,028 1,664 248 1.6% 2023 0.8% 2,062 1,760 145 1.4% 2024 1.0% 2,694 1,799 216 1.2% Wassa Chifeng Jilong Gold Mining Co., Ltd. 2019 4.4% 11,851 1,548 156 7.6% 2020 5.0% 13,429 2,011 168 8.0% 2021 4.9% 14,000 1,690 155 9.0% 2022 5.2% 13,887 1,893 173 8.0% 2023 5.2% 13,573 2,550 232 5.8% 2024 6.3% 16,349 2,228 187 8.7% Wharf Coeur Mining, Inc. 2019 0.6% 1,683 4,185 85 2.0% 2020 0.7% 1,861 4,275 96 1.9% 2021 0.6% 1,801 4,268 92 2.0% 2022 0.5% 1,383 4,090 80 1.7% 2023 0.7% 1,870 4,304 97 1.9% 2024 0.5% 1,171 4,539 101 1.2% Williams 7 Barrick Gold Corporation 2019 0.6% 1,624 2,914 213 0.8% 2020 0.7% 1,775 2,002 223 0.8% 2021 0.4% 1,266 1,237 150 0.8% 2022 0.2% 486 1,180 133 0.4% 2023 (0.2%) (487) 1,265 141 (0.4%) 2024 0.3% 797 1,396 143 0.6% INTRODUCTION ABOUT ROYAL GOLD GOVERNANCE OUR PEOPLE OPERATORS AND COMMUNITIES INVESTMENT STEWARDSHIP APPENDICES Royal Gold | 2025-2026 Investment Stewardship Report 90
Mineral Property/Operator Year 1 Royal Gold Net GEOs 2 (%) Royal Gold Attributable 2 (GEO) Ore Processed 4 (kt) Reported Production 4,5 (kGEO) RGLD % of Site Reported GEO Production 6 Xavantina Ero Copper 2019 —% — — — —% 2020 —% — — — —% 2021 1.2% 3,482 172 38 9.1% 2022 3.1% 8,219 190 44 18.9% 2023 4.1% 10,512 136 60 17.6% 2024 5.0% 13,058 146 58 22.7% Other Interests 2019 0.2% 520 NR NR NR 2020 0.1% 364 NR NR NR 2021 0.2% 526 NR NR NR 2022 0.2% 645 NR NR NR 2023 0.3% 657 NR NR NR 2024 0.1% 253 NR NR NR Total 2019 100.0% 268,001 2020 100.0% 268,012 2021 100.0% 284,177 2022 100.0% 264,614 2023 100.0% 259,267 2024 100.0% 259,688 1. The Company changed its fiscal year end from June 30 to December 31, effective as of December 31, 2021. Accordingly, certain amounts in this table have been adjusted to reflect unaudited calendar year information. 2. GEO production is estimated by multiplying the number of net metal or commodity units of which we take delivery, multiplied by the following standard set of commodity prices and divided by the stated gold price, with the same metal prices used for each year for comparative purposes: $1,758/oz Au; $20.54/oz Ag; $6,185.82/t Cu; $1,826.14/lb Pb; $2,268.85/t Zn; $13,672/t Ni; $25,992/t Mo; $31,161/t Co (see page 136 for complete definition). 3. Royal Gold’s interest is either a portion of the mineral property production or a portion of production from an operating complex. 4. Site production figures were compiled by Skarn Associates, and we have relied on its database for gold and copper mining operations. 5. GEO production is estimated based on the following metal prices for each year using production units identified by Skarn Associates: $1,758/oz Au; $20.54/oz Ag; $6,185.82/t Cu; $1,826.14/lb Pb; $2,268.85/t Zn; $13,672/t Ni; $25,992/t Mo; $31,161/t Co. 6. Royal Gold’s percentage of site production is determined by dividing the net GEO we receive based on the methodology defined in footnote (2) by the Site Reported Production in GEOs, defined in footnote (5). 7. Prior year production adjustments occurred in 2023, resulting in negative production. INTRODUCTION ABOUT ROYAL GOLD GOVERNANCE OUR PEOPLE OPERATORS AND COMMUNITIES INVESTMENT STEWARDSHIP APPENDICES Royal Gold | 2025-2026 Investment Stewardship Report 91
Operator Energy Consumption The following table presents estimates for direct and indirect energy usage, which can be attributed to our interests, for a majority of our revenue-generating mineral properties, as available from Skarn Associates for calendar years 2018 through 2024. The table also details the GHG emissions associated with each unit of direct and indirect energy and provides a weighted average performance for the portfolio. Entries labeled “NR” means the data was not reported in the Skarn Associates database, and those labeled “–” are for periods when Royal Gold did not have royalty or stream revenue from the mineral property. Skarn Associates may update prior year information, which we may have presented in prior reports. We use the most current data available from Skarn Associates and adjust our presentation of data and calculations accordingly. The Operator Energy Consumption table does not include assets from the Sandstorm/Horizon or Kansanshi transactions as these were not in our portfolio during 2024. Mineral Property/Operator Year 1 Royal Gold Net GEOs 2 (%) Total Energy Intensity (GJ/ GEO) Quartile Ranking 8 RGLD Attributed Energy Estimates 4,5 Energy Emission Factor Electrical Power Consumption (kW-hr/t Ore Treated) Direct Indirect Total Direct Indirect Total (Tera Joule) (tCO 2 e/Tera Joule) Principal Properties Andacollo Teck Resources Limited 2019 17.2% 98 319 417 71 113 103 26 2020 13.4% 81 253 334 71 76 75 25 2021 11.4% 103 338 441 71 0 16 30 2022 8.4% 81 254 335 71 0 17 30 2023 8.4% 82 213 295 71 0 20 27 2024 6.5% 4th 60 150 210 71 0 20 27 Cortez 3 Nevada Gold Mines LLC 2019 4.3% 47 18 65 71 81 74 19 2020 6.1% 85 27 112 71 81 73 18 2021 11.0% 179 54 234 71 71 71 12 2022 10.6% 130 45 175 71 91 76 26 2023 18.8% 223 79 302 71 21 58 16 2024 11.3% 3rd 172 64 236 71 17 56 41 INTRODUCTION ABOUT ROYAL GOLD GOVERNANCE OUR PEOPLE OPERATORS AND COMMUNITIES INVESTMENT STEWARDSHIP APPENDICES Royal Gold | 2025-2026 Investment Stewardship Report 92
Mineral Property/Operator Year 1 Royal Gold Net GEOs 2 (%) Total Energy Intensity (GJ/ GEO) Quartile Ranking 8 RGLD Attributed Energy Estimates 4,5 Energy Emission Factor Electrical Power Consumption (kW-hr/t Ore Treated) Direct Indirect Total Direct Indirect Total (Tera Joule) (tCO 2 e/Tera Joule) Mount Milligan Centerra Gold Inc. 2019 23.3% 187 386 573 70 8 29 33 2020 24.8% 203 459 662 70 11 29 30 2021 23.5% 202 443 645 70 3 24 29 2022 27.0% 252 473 725 70 3 26 27 2023 23.5% 237 491 728 70 3 25 27 2024 24.3% 4th 264 475 740 70 4 27 26 Pueblo Viejo Barrick Gold Corporation 2019 17.3% 1,251 0 1,251 77 0 77 266 2020 16.9% 1,404 17 1,422 62 156 64 308 2021 14.1% 1,646 24 1,669 60 164 62 355 2022 12.4% 1,326 19 1,346 60 163 61 305 2023 10.6% 821 27 849 52 149 55 230 2024 9.6% 4th 437 148 477 51 149 59 150 Non-Principal Properties Allan/Borax Nutrien Ltd. 2019 0.3% NR NR NR NR NR NR NR 2020 0.3% NR NR NR NR NR NR NR 2021 0.3% NR NR NR NR NR NR NR 2022 0.3% NR NR NR NR NR NR NR 2023 0.3% NR NR NR NR NR NR NR 2024 0.3% NR NR NR NR NR NR NR NR Bald Mountain 3 Kinross Gold Corporation 2019 0.2% 5 0 5 71 196 82 3 2020 0.0% 1 0 1 71 196 82 3 2021 0.2% 4 0 5 71 155 78 3 2022 0.4% 8 1 9 71 102 74 3 2023 0.3% 8 1 10 71 92 74 3 2024 0.1% 3rd 2 0 3 71 295 95 3 ABOUT ROYAL GOLD INTRODUCTION GOVERNANCE OUR PEOPLE OPERATORS AND COMMUNITIES INVESTMENT STEWARDSHIP APPENDICES Royal Gold | 2025-2026 Investment Stewardship Report 93
Mineral Property/Operator Year 1 Royal Gold Net GEOs 2 (%) Total Energy Intensity (GJ/ GEO) Quartile Ranking 8 RGLD Attributed Energy Estimates 4,5 Energy Emission Factor Electrical Power Consumption (kW-hr/t Ore Treated) Direct Indirect Total Direct Indirect Total (Tera Joule) (tCO 2 e/Tera Joule) Bellevue Bellevue Gold Ltd. 2019 0.0% 0 0 0 NR NR NR NR 2020 0.0% 0 0 0 NR NR NR NR 2021 0.0% 0 0 0 NR NR NR NR 2022 0.0% 0 0 0 NR NR NR NR 2023 0.0% 0 0 0 NR NR NR NR 2024 1.1% NR NR NR NR NR NR NR NR Canadian Malartic 3 Agnico Eagle Mines Ltd. 2019 1.8% 23 15 38 70 0 42 28 2020 1.6% 23 16 39 70 1 41 28 2021 1.5% 18 11 29 70 1 43 24 2022 1.0% 12 9 21 69 1 39 34 2023 0.3% 4 3 6 70 1 42 34 2024 0.1% 3rd 1 1 2 69 0.2 36 35 Celtic/Wonder North Northern Star Resources Ltd. 2019 0.0% 0 0 0 NR NR NR NR 2020 0.0% 0 0 0 NR NR NR NR 2021 0.0% 0 0 0 NR NR NR NR 2022 0.0% 0 0 0 NR NR NR NR 2023 0.0% 0 0 0 NR NR NR NR 2024 0.1% NR NR NR NR NR NR NR NR Côté IAMGOLD Corporation 2019 —% — — — — — — — 2020 —% — — — — — — — 2021 —% — — — — — — — 2022 0.0% 0 0 0 NR NR NR NR 2023 0.0% 0 0 0 NR NR NR NR 2024 0.5% 2nd 9 4 13 69 10 50 39 INTRODUCTION ABOUT ROYAL GOLD GOVERNANCE OUR PEOPLE OPERATORS AND COMMUNITIES INVESTMENT STEWARDSHIP APPENDICES Royal Gold | 2025-2026 Investment Stewardship Report 94
Mineral Property/Operator Year 1 Royal Gold Net GEOs 2 (%) Total Energy Intensity (GJ/ GEO) Quartile Ranking 8 RGLD Attributed Energy Estimates 4,5 Energy Emission Factor Electrical Power Consumption (kW-hr/t Ore Treated) Direct Indirect Total Direct Indirect Total (Tera Joule) (tCO 2 e/Tera Joule) Dolores Pan American Silver Corporation 2019 1.9% 37 10 48 70 128 83 15 2020 1.5% 35 10 45 70 127 83 15 2021 2.0% 27 12 39 70 98 79 14 2022 1.9% 21 12 32 70 44 61 13 2023 1.6% 13 11 24 70 44 58 13 2024 1.1% 2nd 11 9 19 68 123 93 11 Don Nicolas 3 Cerrado Gold, Inc. 2019 0.0% NR NR NR 0 0 0 NR 2020 0.4% 0 0 0 59 0 59 76 2021 0.2% 6 0 6 63 0 63 76 2022 0.2% 5 0 5 63 0 63 76 2023 0.1% 2 0 2 63 0 63 76 2024 0.4% 2nd 11 0 11 67 0 67 14 El Limón Equinox Gold 2019 0.6% 15 5 20 74 83 76 103 2020 0.9% 17 6 23 74 83 76 103 2021 1.0% 19 8 27 74 83 76 113 2022 1.2% 12 10 22 73 0 39 141 2023 1.1% 13 10 24 70 0 40 150 2024 1.2% 3rd 15 12 27 70 0 39 154 Goldstrike 3 Nevada Gold Mines LLC (Goldstrike and Carlin were combined by Nevada Gold Mines for reporting purposes starting in 2019 and are referred to as Carlin.) 2019 0.9% 41 18 59 77 59 72 288 2020 0.7% 26 8 33 79 81 79 143 2021 0.6% 26 7 33 78 77 78 114 2022 0.7% 23 4 27 88 145 96 163 2023 0.3% 14 3 17 74 17 63 246 2024 0.3% 4th 15 3 18 75 15 64 275 INTRODUCTION ABOUT ROYAL GOLD GOVERNANCE OUR PEOPLE OPERATORS AND COMMUNITIES INVESTMENT STEWARDSHIP APPENDICES Royal Gold | 2025-2026 Investment Stewardship Report 95
Mineral Property/Operator Year 1 Royal Gold Net GEOs 2 (%) Total Energy Intensity (GJ/ GEO) Quartile Ranking 8 RGLD Attributed Energy Estimates 4,5 Energy Emission Factor Electrical Power Consumption (kW-hr/t Ore Treated) Direct Indirect Total Direct Indirect Total (Tera Joule) (tCO 2 e/Tera Joule) Granite Creek i-80 Gold Corp. 2019 0.0% 0 0 0 NR NR NR NR 2020 0.0% 0 0 0 NR NR NR NR 2021 0.0% 0 0 0 NR NR NR NR 2022 0.0% 0 0 0 NR NR NR NR 2023 0.0% 0 0 0 NR NR NR NR 2024 0.2% NR NR NR NR NR NR NR NR Gwalia 3 Genesis Minerals Limited 2019 1.0% 18 0 18 62 0 62 134 2020 0.9% 21 0 21 61 0 61 164 2021 0.9% 21 0 21 60 0 60 130 2022 0.8% 21 0 21 60 0 60 130 2023 0.7% 18 0 18 61 0 61 130 2024 0.7% 4th 18 0 19 59 182 60 125 Khoemacau MMG Limited (formally Khoemacau Copper) 2019 —% — — — — — — — 2020 —% — — — — — — — 2021 0.7% 5 6 11 74 259 172 2022 3.1% 22 25 46 74 259 172 52 2023 5.4% 36 38 74 74 233 157 49 2024 4.3% 1st (Cu) 39 40 79 71 274 176 50 King of the Hills Vault Minerals Limited 2019 0.4% 0 0 0 NR NR NR NR 2020 0.2% 0 0 0 NR NR NR NR 2021 0.0% 0 0 0 NR NR NR NR 2022 0.2% 10 0 10 64 0 64 35 2023 0.8% 27 0 27 62 0 62 42 2024 0.9% 4th 30 0 30 63 0 63 36 INTRODUCTION ABOUT ROYAL GOLD GOVERNANCE OUR PEOPLE OPERATORS AND COMMUNITIES INVESTMENT STEWARDSHIP APPENDICES Royal Gold | 2025-2026 Investment Stewardship Report 96
Mineral Property/Operator Year 1 Royal Gold Net GEOs 2 (%) Total Energy Intensity (GJ/ GEO) Quartile Ranking 8 RGLD Attributed Energy Estimates 4,5 Energy Emission Factor Electrical Power Consumption (kW-hr/t Ore Treated) Direct Indirect Total Direct Indirect Total (Tera Joule) (tCO 2 e/Tera Joule) LaRonde Zone 5 3 Agnico Eagle Mines Ltd. 2019 0.5% 2 5 7 59 1 18 147 2020 0.4% 2 5 6 60 0 16 152 2021 0.4% 2 5 6 61 0 17 147 2022 0.6% 3 7 9 61 0 17 162 2023 0.5% 2 6 9 61 0 17 162 2024 0.6% 2nd 3 8 11 62 0 176 167 Leeville (North) 3 Nevada Gold Mines LLC (Scope 1 emissions included portions of emissions from the Western 102 and TS power plants.) 2019 0.3% 15 6 21 77 59 72 288 2020 0.3% 12 4 16 79 81 79 143 2021 1.0% 45 12 57 78 77 78 114 2022 0.9% 31 6 37 88 145 96 163 2023 1.1% 49 12 61 74 17 63 246 2024 1.3% 4th 68 15 84 75 0 64 275 Manh Choh Kinross Gold Corporation 2019 0.0% 0 0 0 NR NR NR NR 2020 0.0% 0 0 0 NR NR NR NR 2021 0.0% 0 0 0 NR NR NR NR 2022 0.0% 0 0 0 NR NR NR NR 2023 0.0% 0 0 0 NR NR NR NR 2024 1.7% 2nd 33 7 40 71 296 109 6 Mara Rosa Hochschild Mining plc 2019 0.0% 0 0 0 NR NR NR NR 2020 0.0% 0 0 0 NR NR NR NR 2021 0.0% 0 0 0 NR NR NR NR 2022 0.0% 0 0 0 NR NR NR NR 2023 0.0% 0 0 0 NR NR NR NR 2024 0.7% 2nd 6 7 13 74 23 47 39 INTRODUCTION ABOUT ROYAL GOLD GOVERNANCE OUR PEOPLE OPERATORS AND COMMUNITIES INVESTMENT STEWARDSHIP APPENDICES Royal Gold | 2025-2026 Investment Stewardship Report 97
Mineral Property/Operator Year 1 Royal Gold Net GEOs 2 (%) Total Energy Intensity (GJ/ GEO) Quartile Ranking 8 RGLD Attributed Energy Estimates 4,5 Energy Emission Factor Electrical Power Consumption (kW-hr/t Ore Treated) Direct Indirect Total Direct Indirect Total (Tera Joule) (tCO 2 e/Tera Joule) Marigold 3 SSR Mining Inc. 2019 1.5% 27 2 29 70 81 68 1 2020 1.7% 39 3 42 70 81 64 2 2021 1.6% 43 3 46 70 97 63 2 2022 1.3% 32 2 34 70 98 65 2 2023 1.0% 19 2 21 70 92 72 3 2024 1.3% 4th 38 5 43 75 104 73 2 Meekathara 3 Westgold Resources Ltd. 2019 0.7% 20 0 20 70 0 70 56 2020 0.8% 24 0 24 70 0 70 56 2021 0.7% 22 0 22 70 0 70 53 2022 0.6% 17 0 17 70 0 70 55 2023 0.4% 12 0 12 70 0 70 63 2024 0.1% NR NR NR NR 60 0 60 62 Peñasquito Newmont Corporation 2019 4.1% 67 61 127 74 129 100 51 2020 7.1% 63 66 129 74 127 101 41 2021 8.2% 87 81 168 74 111 91 41 2022 7.6% 85 75 160 74 117 94 39 2023 3.4% 44 74 119 74 71 72 67 2024 7.7% 4th 88 148 235 74 72 73 67 Rainy River Coeur Mining, Inc. 2019 5.5% 106 54 160 70 2 47 32 2020 4.7% 89 53 142 70 6 46 31 2021 5.2% 111 65 176 70 6 46 32 2022 5.0% 94 59 154 70 8 46 34 2023 5.8% 101 64 165 70 11 47 35 2024 5.6% 3rd 83 71 154 70 8 41 35 INTRODUCTION ABOUT ROYAL GOLD GOVERNANCE OUR PEOPLE OPERATORS AND COMMUNITIES INVESTMENT STEWARDSHIP APPENDICES Royal Gold | 2025-2026 Investment Stewardship Report 98
Mineral Property/Operator Year 1 Royal Gold Net GEOs 2 (%) Total Energy Intensity (GJ/ GEO) Quartile Ranking 8 RGLD Attributed Energy Estimates 4,5 Energy Emission Factor Electrical Power Consumption (kW-hr/t Ore Treated) Direct Indirect Total Direct Indirect Total (Tera Joule) (tCO 2 e/Tera Joule) Red Chris Newmont Corporation 2019 —% — — — — — — — 2020 —% — — — — — — — 2021 —% — — — — — — — 2022 0.5% 11 9 20 65 7 37 34 2023 0.6% 15 13 28 69 5 39 36 2024 0.4% 4th 12 11 23 69 4 38 59 Robinson KGHM International Ltd. 2019 1.9% 46 46 92 71 158 114 41 2020 2.2% 64 63 127 71 158 114 41 2021 1.8% 44 44 88 71 158 114 41 2022 1.9% 50 49 100 71 158 114 41 2023 1.5% 44 44 88 71 158 114 41 2024 2.5% 4th 58 58 116 71 180 125 41 Skyline Wolverine Fuels, LLC 2019 0.3% NR NR NR NR NR NR NR 2020 0.3% NR NR NR NR NR NR NR 2021 0.1% NR NR NR NR NR NR NR 2022 0.0% NR NR NR NR NR NR NR 2023 0.3% NR NR NR NR NR NR NR 2024 0.3% NR NR NR NR NR NR NR NR South Laverton 3 Northern Star Resources Ltd. 2019 1.1% 18 0 18 74 0 74 36 2020 2.2% 36 0 36 74 0 74 36 2021 1.9% 46 0 46 70 0 70 49 2022 1.3% 40 0 40 74 0 74 21 2023 1.4% 31 0 31 73 0 73 29 2024 1.4% 3rd 33 0 33 63 0 63 15 INTRODUCTION ABOUT ROYAL GOLD GOVERNANCE OUR PEOPLE OPERATORS AND COMMUNITIES INVESTMENT STEWARDSHIP APPENDICES Royal Gold | 2025-2026 Investment Stewardship Report 99
Mineral Property/Operator Year 1 Royal Gold Net GEOs 2 (%) Total Energy Intensity (GJ/ GEO) Quartile Ranking 8 RGLD Attributed Energy Estimates 4,5 Energy Emission Factor Electrical Power Consumption (kW-hr/t Ore Treated) Direct Indirect Total Direct Indirect Total (Tera Joule) (tCO 2 e/Tera Joule) Southern Cross Shandong Tianye Group 2019 0.4% 4 2 6 74 192 116 36 2020 0.3% 3 1 4 74 189 111 29 2021 0.3% 3 2 5 74 187 116 34 2022 0.3% 2 2 4 74 182 129 55 2023 0.3% 2 2 5 74 182 129 54 2024 0.4% 2nd 3 3 5 74 149 112 54 Voisey’s Bay Vale S.A. 2019 2.0% 16 0 16 71 0 71 52 2020 1.5% 11 0 11 71 0 71 52 2021 2.6% 22 0 22 71 0 71 52 2022 1.5% 21 0 21 71 0 71 60 2023 0.8% 19 0 19 71 0 71 57 2024 1.0% 2nd (Cu) 47 0 47 71 0 71 173 Wassa Chifeng Jilong Gold Mining Co., Ltd. 2019 4.4% 22 21 44 71 36 54 50 2020 5.0% 23 26 50 71 37 53 46 2021 4.9% 34 34 69 71 184 127 62 2022 5.2% 34 34 68 71 184 128 62 2023 5.2% 22 30 51 71 188 140 56 2024 6.3% 2nd 24 39 63 74 189 145 56 Wharf Coeur Mining, Inc. 2019 0.6% 9 7 16 71 114 88 22 2020 0.7% 7 7 13 71 96 83 22 2021 0.6% 14 7 21 71 43 62 22 2022 0.5% 13 6 18 71 46 63 22 2023 0.7% 17 2 20 71 113 68 7 2024 0.5% 3rd 10 1 11 63 114 68 6 INTRODUCTION ABOUT ROYAL GOLD GOVERNANCE OUR PEOPLE OPERATORS AND COMMUNITIES INVESTMENT STEWARDSHIP APPENDICES Royal Gold | 2025-2026 Investment Stewardship Report 100
Mineral Property/Operator Year 1 Royal Gold Net GEOs 2 (%) Total Energy Intensity (GJ/ GEO) Quartile Ranking 8 RGLD Attributed Energy Estimates 4,5 Energy Emission Factor Electrical Power Consumption (kW-hr/t Ore Treated) Direct Indirect Total Direct Indirect Total (Tera Joule) (tCO 2 e/Tera Joule) Williams 7 Barrick Gold Corporation 2019 0.6% 4 6 10 66 5 31 77 2020 0.7% 4 5 9 65 8 32 101 2021 0.4% 3 5 8 63 8 27 153 2022 0.2% 1 2 4 64 8 28 155 2023 (0.2%) -1 -2 -3 62 8 27 140 2024 0.3% 2nd 2 3 5 61 8 26 127 Xavantina Ero Copper 2019 —% — — — — — — — 2020 —% — — — — — — — 2021 1.2% 4 9 12 74 17 34 154 2022 3.1% 9 18 27 74 17 36 141 2023 4.1% 6 12 18 74 17 36 141 2024 5.0% 2nd 12 24 36 61 13 31 203 Other Interests 2019 0.2% NR NR NR NR NR NR NR 2020 0.1% NR NR NR NR NR NR NR 2021 0.2% NR NR NR NR NR NR NR 2022 0.2% NR NR NR NR NR NR NR 2023 0.3% NR NR NR NR NR NR NR 2024 0.1% NR NR NR NR NR NR NR NR INTRODUCTION ABOUT ROYAL GOLD GOVERNANCE OUR PEOPLE OPERATORS AND COMMUNITIES INVESTMENT STEWARDSHIP APPENDICES Royal Gold | 2025-2026 Investment Stewardship Report 101
Portfolio Energy Intensity Summary Year 1 Royal Gold Net GEOs 2 (%) Industry Quartile Ranking 10 RGLD Attributed Energy Estimates 4,5 RGLD Attributed Energy Intensity Energy Emission Factor Electrical Power Consumption (kW-hr/t Ore Treated) Direct Indirect Total (Tera Joule) Direct Indirect Total (Giga Joule/GEO) Direct Indirect Total (tCO 2 e/ Tera Joule) Properties With Energy Estimates 2019 98.7% 4th 2,150 1,047 3,197 8.1 4 12.1 75 60 70 40 2020 99.1% 4th 2,329 1,069 3,398 8.8 4.0 12.8 67 51 62 40 2021 99.4% 4th 2,773 1,181 3,954 9.8 4.2 14 65 31 55 41 2022 99.4% 4th 2,383 1,135 3,517 9.1 4.3 13.4 65 34 55 41 2023 99.2% 4th 1,889 1,143 3,032 7.3 4.4 11.8 62 33 51 36 2024 97.9% 4th 1,603 1,199 2,803 7.3 4.4 11.0 65 45 57 35 Properties Without Emissions Data 6 2019 1.3% 29 14 43 2020 0.9% 21 10 31 2021 0.6% 15 7 22 2022 0.6% 14 6 20 2023 0.8% 16 9 25 2024 2.1% 35 26 61 Total 2019 100.0% 2,179 1,061 3,240 8.1 4.0 12.1 75 60 70 2020 100.0% 2,350 1,079 3,429 8.8 4.0 12.8 67 51 62 2021 100.0% 2,788 1,188 3,976 9.8 4.2 14.0 65 31 55 2022 100.0% 2,397 1,141 3,537 9.1 4.3 13.4 65 34 55 2023 100.0% 1,905 1,152 3,057 7.3 4.4 11.8 62 33 51 2024 100.0% 1,638 1,225 2,864 7.3 4.4 11.0 65 45 57 INTRODUCTION ABOUT ROYAL GOLD GOVERNANCE OUR PEOPLE OPERATORS AND COMMUNITIES INVESTMENT STEWARDSHIP APPENDICES Royal Gold | 2025-2026 Investment Stewardship Report 102
1. The Company changed its fiscal year end from June 30 to December 31, effective as of December 31, 2021. Accordingly, certain amounts in this table have been adjusted to reflect unaudited calendar year information. 2. GEO production is estimated by multiplying the number of net metal or commodity units of which we take delivery, multiplied by the following standard set of commodity prices and divided by the stated gold price, with the same metal prices used for each year for comparative purposes: $1,758/oz Au; $20.54/oz Ag; $6,185.82/t Cu; $1,826.14/lb Pb; $2,268.85/t Zn; $13,672/t Ni; $25,992/t Mo; $31,161/t Co (see page 136 for complete definition). 3. Royal Gold’s interest is either a portion of the mineral property or part of a complex, and energy usage is assumed to be equally proportioned to all GEOs. 4. Mine site energy estimates were compiled by Skarn Associates, and we have relied on its database for energy presented for gold and copper mining operations. 5. Royal Gold’s attributed energy consumption = Site energy consumption x Royal Gold % of site production. 6. Energy intensity for mineral properties that were not included in the Skarn Associates database have been assumed to be equal to the average of the portfolio. 7. Prior year production adjustments occurred in 2023, resulting in negative production. 8. Industry quartile ranking is based both on Skarn Associates’ energy intensity curve for gold production (GJ/oz Au) and its energy intensity curve for copper production (GJ/t Cu). Operations are benchmarked against the gold production intensity curve unless otherwise indicated with the designation “(Cu)” indicating the ranking is based on the copper energy consumption intensity curve. INTRODUCTION ABOUT ROYAL GOLD GOVERNANCE OUR PEOPLE OPERATORS AND COMMUNITIES INVESTMENT STEWARDSHIP APPENDICES Royal Gold | 2025-2026 Investment Stewardship Report 103
Operator GHG Emissions The following table presents scope 1 and 2 GHG emissions performance data for a majority of our revenue-generating mineral properties, as available from Skarn Associates for calendar years 2018 through 2024. The table also provides the emissions estimates that can be attributed to our streams and royalties and the average emission intensity for our portfolio. We have estimates of GHG emissions associated with about 99% of our net GEOs in each of the six years presented. The process to calculate the GHG emission footprint for our portfolio is described in detail on page 136 . Entries labeled “NR” means the data was not reported in the Skarn Associates database, and those labeled “–” are for periods when Royal Gold did not have royalty or stream revenue from the mineral property. Skarn Associates may update prior year information. We use the most current data available from Skarn Associates and adjust our presentation of data and calculations accordingly. The Operator GHG Emissions table does not include assets from the Sandstorm/Horizon or Kansanshi transactions as these were not in our portfolio during 2024. Mineral Property/Operator Year 1 Royal Gold Net GEOs 2 (%) Operator Emission Estimates 4 Operator Emission Intensity 2, 4 GHG Emissions Intensity Quartile Ranking 8 RGLD Attributed Emissions 5 Scope 1 Scope 2 Scope 1 & 2 Scope 1 Scope 2 Scope 1 & 2 Scope 1 Scope 2 Scope 1 & 2 (tCO 2 e) (tCO 2 e/GEO) (tCO 2 e) Principal Properties Andacollo 2019 17.2% 35,000 181,966 216,965 0.15 0.78 0.93 6,918 35,968 42,887 Teck Resources Limited 2020 13.4% 39,680 133,247 172,927 0.16 0.54 0.70 5,749 19,305 25,053 2021 11.4% 42,616 0.00 42,616 0.22 0.00 0.22 7,273 0.00 7,273 2022 8.4% 41,650 0.00 41,650 0.26 0.00 0.26 5,707 0.00 5,707 2023 8.4% 42,405 0.00 42,405 0.27 0.00 0.27 5,790 0.00 5,790 2024 6.5% 39,000 0.00001 39,000 0.25 0.00 0.25 1st 4,232 0.0 4,232 Cortez 3 2019 4.3% 274,152 123,849 398,001 0.28 0.13 0.41 3,289 1,486 4,774 Nevada Gold Mines LLC 2020 6.1% 292,832 108,216 401,047 0.37 0.14 0.50 5,998 2,217 8,215 2021 11.0% 297,000 56,000 353,000 0.41 0.08 0.48 12,663 2,388 15,050 2022 10.6% 284,000 42,000 326,000 0.33 0.05 0.38 9,182 1,358 10,540 2023 18.8% 289,000 30,000 319,000 0.32 0.03 0.36 15,761 1,636 17,397 2024 11.3% 299,000 27,250 326,250 0.41 0.04 0.45 2nd 12,114 1,104 13,217 Mount Milligan 2019 23.3% 65,741 16,018 81,759 0.21 0.05 0.26 13,148 3,204 16,351 Centerra Gold Inc. 2020 24.8% 66,580 23,867 90,447 0.21 0.08 0.29 14,265 5,114 19,379 2021 23.5% 69,406 5,848 75,254 0.21 0.02 0.23 14,168 1,194 15,361 2022 27.0% 78,652 6,714 85,366 0.25 0.02 0.27 17,695 1,511 19,205 2023 23.5% 72,493 7,075 79,568 0.27 0.03 0.30 16,664 1,626 18,290 2024 24.3% 77,335 6,988 84,323 0.29 0.03 0.32 1st 18,583 1,679 20,262 INTRODUCTION ABOUT ROYAL GOLD GOVERNANCE OUR PEOPLE OPERATORS AND COMMUNITIES INVESTMENT STEWARDSHIP APPENDICES Royal Gold | 2025-2026 Investment Stewardship Report 104
Mineral Property/Operator Year 1 Royal Gold Net GEOs 2 (%) Operator Emission Estimates 4 Operator Emission Intensity 2, 4 GHG Emissions Intensity Quartile Ranking 8 RGLD Attributed Emissions 5 Scope 1 Scope 2 Scope 1 & 2 Scope 1 Scope 2 Scope 1 & 2 Scope 1 Scope 2 Scope 1 & 2 (tCO 2 e) (tCO 2 e/GEO) (tCO 2 e) Pueblo Viejo 2019 17.3% 2,165,898 0 2,165,898 2.07 0 2.07 95,994 0 95,994 Barrick Gold Corporation 2020 16.9% 1,860,150 57,914 1,918,064 1.94 0.06 2.00 87,648 2,729 90,377 2021 14.1% 2,129,000 85,000 2,214,000 2.46 0.10 2.56 98,819 3,945 102,764 2022 12.4% 1,847,000 73,000 1,920,000 2.41 0.10 2.50 79,228 3,131 82,359 2023 10.6% 1,787,000 87,000 1,874,000 3.00 0.15 3.15 82,710 4,027 86,737 2024 9.6% 1,916,000 151,779 2,067,779 3 0.24 3 4th 76,014 6,022 82,035 Non-Principal Properties Allan/Borax 2019 0.3% NR NR NR NR NR NR NR NR NR Nutrien Ltd. 2020 0.3% NR NR NR NR NR NR NR NR NR 2021 0.3% NR NR NR NR NR NR NR NR NR 2022 0.3% NR NR NR NR NR NR NR NR NR 2023 0.3% NR NR NR NR NR NR NR NR NR 2024 0.3% NR NR NR NR NR NR NR NR NR NR Bald Mountain 3 2019 0.2% 115,195 30,245 145,440 0.61 0.16 0.77 361 95 456 Kinross Gold Corporation 2020 0.0% 127,155 33,951 161,106 0.66 0.18 0.84 55 15 70 2021 0.2% 127,142 26,931 154,073 0.62 0.13 0.75 305 65 369 2022 0.4% 117,108 17,277 134,385 0.55 0.08 0.63 555 82 636 2023 0.3% 110,964 17,577 128,541 0.70 0.11 0.82 615 97 712 2024 0.1% 112,509 56,299 168,808 0.62 0.31 0.93 3rd 161 81 242 Bellevue 2019 0.0% NR NR NR NR NR NR NR NR NR Bellevue Gold Ltd. 2020 0.0% NR NR NR NR NR NR NR NR NR 2021 0.0% NR NR NR NR NR NR NR NR NR 2022 0.0% NR NR NR NR NR NR NR NR NR 2023 0.0% NR NR NR NR NR NR NR NR NR 2024 1.1% NR NR NR NR NR NR NR NR NR NR INTRODUCTION ABOUT ROYAL GOLD GOVERNANCE OUR PEOPLE OPERATORS AND COMMUNITIES INVESTMENT STEWARDSHIP APPENDICES Royal Gold | 2025-2026 Investment Stewardship Report 105
Mineral Property/Operator Year 1 Royal Gold Net GEOs 2 (%) Operator Emission Estimates 4 Operator Emission Intensity 2, 4 GHG Emissions Intensity Quartile Ranking 8 RGLD Attributed Emissions 5 Scope 1 Scope 2 Scope 1 & 2 Scope 1 Scope 2 Scope 1 & 2 Scope 1 Scope 2 Scope 1 & 2 (tCO 2 e) (tCO 2 e/GEO) (tCO 2 e) Canadian Malartic 3 2019 1.8 % 228,467 874 229,341 0.34 0.00 0.34 1,626 6 1,632 Agnico Eagle Mines Ltd. 2020 1.6 % 210,457 1,100 211,557 0.37 0.00 0.37 1,619 8 1,627 2021 1.5 % 219,283 1,025 220,308 0.30 0.00 0.31 1,270 6 1,276 2022 1.0% 210,117 1,273 211,390 0.32 0.00 0.32 821 5 826 2023 0.3% 250,725 1,283 252,008 0.36 0.00 0.36 271 1 273 2024 0.1% 186,282 499 186,782 0.28 0.00 0.28 1st 71 0 72 Celtic/Wonder North 2019 0.0% NR NR NR NR NR NR NR NR NR Northern Star Resources Ltd. 2020 0.0% NR NR NR NR NR NR NR NR NR 2021 0.0% NR NR NR NR NR NR NR NR NR 2022 0.0% NR NR NR NR NR NR NR NR NR 2023 0.0% NR NR NR NR NR NR NR NR NR 2024 0.1% NR NR NR NR NR NR NR NR NR NR Côté 2019 — — — — — — — — — — IAMGOLD Corporation 2020 — — — — — — — — — — 2021 — — — — — — — — — — 2022 0.0% NR NR NR NR NR NR NR NR NR 2023 0.0% NR NR NR NR NR NR NR NR NR 2024 0.5% 101,324 34,891 108,111 0.51 0.03 0.54 2nd 624 42 666 Dolores 2019 1.9% 93,898 46,883 140,781 0.53 0.26 0.79 2,666 1,331 3,996 Pan American Silver Corporation 2020 1.5% 87,521 43,884 131,405 0.62 0.31 0.92 2,492 1,250 3,742 2021 2.0% 64,650 38,516 103,166 0.35 0.21 0.55 1,964 1,170 3,134 2022 1.9% 48,116 16,206 64,322 0.30 0.10 0.39 1,501 506 2,007 2023 1.6% 31,889 15,514 47,403 0.24 0.12 0.36 983 478 1,462 2024 1.1% 24,135 34,891 59,026 0.26 0.38 0.64 3rd 737 1,066 1,803 INTRODUCTION ABOUT ROYAL GOLD GOVERNANCE OUR PEOPLE OPERATORS AND COMMUNITIES INVESTMENT STEWARDSHIP APPENDICES Royal Gold | 2025-2026 Investment Stewardship Report 106
Mineral Property/Operator Year 1 Royal Gold Net GEOs 2 (%) Operator Emission Estimates 4 Operator Emission Intensity 2, 4 GHG Emissions Intensity Quartile Ranking 8 RGLD Attributed Emissions 5 Scope 1 Scope 2 Scope 1 & 2 Scope 1 Scope 2 Scope 1 & 2 Scope 1 Scope 2 Scope 1 & 2 (tCO 2 e) (tCO 2 e/GEO) (tCO 2 e) Don Nicolas 3 2019 0.0% 0.00 0.00 0.00 0.00 0.00 0.00 0.00 0.00 0.00 Cerrado Gold, Inc. 2020 0.4% 15,979 0.00 15,979 0.94 0.00 0.94 1,074 0.00 1,074 2021 0.2% 29,257 0.00 29,257 0.67 0.00 0.67 386 0.00 386 2022 0.2% 28,522 0.00 28,522 0.53 0.00 0.53 340 0.00 340 2023 0.1% 35,545 0.00 35,545 0.52 0.00 0.52 117 0.00 117 2024 0.4% 36,919 0.00 36,919 0.68 0.00 0.68 3rd 743 0.00 743 El Limón 2019 0.6% 41,434 14,738 56,171 0.66 0.23 0.89 1,142 406 1,548 Equinox Gold 2020 0.9% 35,308 13,088 48,396 0.54 0.20 0.75 1,273 472 1,745 2021 1.0% 35,912 16,735 52,646 0.53 0.25 0.78 1,433 668 2,101 2022 1.2% 21,668 0.00 21,668 0.28 0.00 0.28 887 0.00 887 2023 1.1% 24,849 0.00 24,849 0.34 0.00 0.34 937 0.00 937 2024 1.2% 24,851 0.00 24,851 0.35 0.00 0.35 1st 1,066 0.00 1,066 Goldstrike 3 2019 0.9% 2,277,984 742,215 3,020,199 1.32 0.43 1.76 3,208 1,045 4,254 Nevada Gold Mines LLC 2020 0.7% 1,749,640 526,175 2,275,816 1.05 0.32 1.37 2,044 615 2,659 (Goldstrike and Carlin were combined by Nevada Gold Mines for reporting purposes starting in 2019 and are referred to as Carlin.) 2021 0.6% 1,792,700 320,000 2,112,700 1.19 0.21 1.41 2,005 358 2,363 2022 0.7% 1,924,900 148,000 2,072,900 1.17 0.09 1.26 2,027 156 2,183 2023 0.3% 1,758,200 96,000 1,854,200 1.25 0.07 1.31 1,013 55 1,069 2024 0.3% 1,928,400 85,155 2,013,555 1.53 0.07 1.60 4th 1,120 49 1,169 Granite Creek 2019 0.0% NR NR NR NR NR NR NR NR NR i-80 Gold Corp. 2020 0.0% NR NR NR NR NR NR NR NR NR 2021 0.0% NR NR NR NR NR NR NR NR NR 2022 0.0% NR NR NR NR NR NR NR NR NR 2023 0.0% NR NR NR NR NR NR NR NR NR 2024 0.2% NR NR NR NR NR NR NR NR NR NR INTRODUCTION ABOUT ROYAL GOLD GOVERNANCE OUR PEOPLE OPERATORS AND COMMUNITIES INVESTMENT STEWARDSHIP APPENDICES Royal Gold | 2025-2026 Investment Stewardship Report 107
Mineral Property/Operator Year 1 Royal Gold Net GEOs 2 (%) Operator Emission Estimates 4 Operator Emission Intensity 2, 4 GHG Emissions Intensity Quartile Ranking 8 RGLD Attributed Emissions 5 Scope 1 Scope 2 Scope 1 & 2 Scope 1 Scope 2 Scope 1 & 2 Scope 1 Scope 2 Scope 1 & 2 (tCO 2 e) (tCO 2 e/GEO) (tCO 2 e) Gwalia 3 2019 1.0% 74,803 0.00 74,803 0.41 0.00 0.41 1,129 0 1,129 Genesis Minerals Limited 2020 0.9% 86,500 0.00 86,500 0.56 0.00 0.56 1,270 0 1,270 2021 0.9% 93,000 0.00 93,000 0.49 0.00 0.49 1,278 0 1,278 2022 0.8% 90,218 0.00 90,218 0.57 0.00 0.57 1,277 0 1,277 2023 0.7% 101,435 0.00 101,435 0.56 0.00 0.56 1,082 0 1,082 2024 0.7% 97,905 1,132 99,037 0.65 0.01 0.65 3rd 1,094 13 1,107 Khoemacau 2019 —% — — — — — — — — — MMG Limited 2020 —% — — — — — — — — — (formally Khoemacau Copper) 2021 0.7% 22,069 87,148 109,218 0.18 0.72 0.90 373 1,473 1,846 2022 3.1% 44,139 174,296 218,435 0.19 0.77 0.96 1,608 6,351 7,959 2023 5.4% 39,949 134,235 174,184 0.19 0.64 0.83 2,657 8,929 11,587 2024 4.3% 39,233 149,100 188,333 0.26 0.99 1.25 4th (Cu) 2,906 11,045 13,951 King of the Hills 2019 0.4% NR NR NR NR NR NR NR NR NR Vault Minerals Limited 2020 0.2% NR NR NR NR NR NR NR NR NR 2021 0.03% NR NR NR NR NR NR NR NR NR 2022 0.2% 87,061 0.00 87,061 1.25 0.00 1.25 635 0 635 2023 0.8% 159,974 0.00 159,974 0.76 0.00 0.76 1,639 0 1,639 2024 0.9% 166,373 0.00 166,373 0.83 0.00 0.83 3rd 1,851 0 1,851 LaRonde Zone 5 3 2019 0.5% 38,306 861 39,167 0.09 0.00 0.09 116 3 119 Agnico Eagle Mines Ltd. 2020 0.4% 31,861 204 32,065 0.09 0.00 0.09 100 1 100 2021 0.4% 35,820 217 36,037 0.09 0.00 0.09 107 1 108 2022 0.6% 41,181 274 41,455 0.11 0.00 0.11 164 1 165 2023 0.5% 38,880 259 39,139 0.12 0.00 0.12 152 1 153 2024 0.6% 46,579 339 46,918 0.14 0.00 0.14 1st 214 2 216 INTRODUCTION ABOUT ROYAL GOLD GOVERNANCE OUR PEOPLE OPERATORS AND COMMUNITIES INVESTMENT STEWARDSHIP APPENDICES Royal Gold | 2025-2026 Investment Stewardship Report 108
Mineral Property/Operator Year 1 Royal Gold Net GEOs 2 (%) Operator Emission Estimates 4 Operator Emission Intensity 2, 4 GHG Emissions Intensity Quartile Ranking 8 RGLD Attributed Emissions 5 Scope 1 Scope 2 Scope 1 & 2 Scope 1 Scope 2 Scope 1 & 2 Scope 1 Scope 2 Scope 1 & 2 (tCO 2 e) (tCO 2 e/GEO) (tCO 2 e) Leeville (North) 3 2019 0.3% 2,277,984 742,215 3,020,199 1.32 0.43 1.76 1,123 366 1,489 Nevada Gold Mines LLC 2020 0.3% 1,749,640 526,175 2,275,816 1.05 0.32 1.37 976 294 1,270 (Scope 1 emissions included portions of emissions from the Western 102 and TS power plants.) 2021 1.0% 1,792,700 320,000 2,112,700 1.19 0.21 1.41 3,519 628 4,147 2022 0.9% 1,924,900 148,000 2,072,900 1.17 0.09 1.26 2,731 210 2,941 2023 1.1% 1,758,200 96,000 1,854,200 1.25 0.07 1.31 3,678 201 3,879 2024 1.3% 1,928,400 85,155 2,013,555 1.53 0.07 1.60 4th 5,089 225 5,314 Manh Choh 2019 0.0% NR NR NR NR NR NR NR NR NR Kinross Gold Corporation 2020 0.0% NR NR NR NR NR NR NR NR NR 2021 0.0% NR NR NR NR NR NR NR NR NR 2022 0.0% NR NR NR NR NR NR NR NR NR 2023 0.0% NR NR NR NR NR NR NR NR NR 2024 1.7% 256,859 220,425 477,284 0.54 0.46 0.99 4th 2,397 2,057 4,453 Mara Rosa 2019 0.0% NR NR NR NR NR NR NR NR NR Hochschild Mining plc 2020 0.0% NR NR NR NR NR NR NR NR NR 2021 0.0% NR NR NR NR NR NR NR NR NR 2022 0.0% NR NR NR NR NR NR NR NR NR 2023 0.0% NR NR NR NR NR NR NR NR NR 2024 0.7% 16,141 5,726 21,867 0.25 0.09 0.34 1st 455 162 617 Marigold 3 2019 1.5% 101,861 10,284 112,145 0.46 0.05 0.51 1,869 189 2,058 SSR Mining Inc. 2020 1.7% 138,792 10,616 149,408 0.59 0.05 0.64 2,741 210 2,951 2021 1.6% 152,504 12,906 165,410 0.65 0.05 0.70 3,022 256 3,278 2022 1.3% 150,063 16,622 166,685 0.65 0.07 0.72 2,210 245 2,455 2023 1.0% 132,143 18,973 151,115 0.51 0.07 0.58 1,340 192 1,532 2024 1.3% 131,928 23,768 155,697 0.78 0.14 0.93 3rd 2,658 479 3,137 INTRODUCTION ABOUT ROYAL GOLD GOVERNANCE OUR PEOPLE OPERATORS AND COMMUNITIES INVESTMENT STEWARDSHIP APPENDICES Royal Gold | 2025-2026 Investment Stewardship Report 109
Mineral Property/Operator Year 1 Royal Gold Net GEOs 2 (%) Operator Emission Estimates 4 Operator Emission Intensity 2, 4 GHG Emissions Intensity Quartile Ranking 8 RGLD Attributed Emissions 5 Scope 1 Scope 2 Scope 1 & 2 Scope 1 Scope 2 Scope 1 & 2 Scope 1 Scope 2 Scope 1 & 2 (tCO 2 e) (tCO 2 e/GEO) (tCO 2 e) Meekathara 3 2019 0.7% 122,832 0.00 122,832 0.71 0.00 0.71 1,408 0.00 1,408 Westgold Resources Ltd. 2020 0.8% 145,905 0.00 145,905 0.80 0.00 0.80 1,676 0.00 1,676 2021 0.7% 148,748 0.00 148,748 0.78 0.00 0.78 1,542 0.00 1,542 2022 0.6% 142,447 0.00 142,447 0.71 0.00 0.71 1,161 0.00 1,161 2023 0.4% 130,348 0.00 130,348 0.74 0.00 0.74 810 0.00 810 2024 0.1% 86,533 0.00 86,533 0.611 0.00 0.611 3rd 114 0.00 114 Peñasquito 2019 4.1% 300,254 475,382 775,635 0.45 0.72 1.17 4,945 7,829 12,774 Newmont Corporation 2020 7.1% 321,156 577,458 898,614 0.24 0.44 0.68 4,658 8,375 13,032 2021 8.2% 418,372 578,188 996,560 0.28 0.38 0.66 6,461 8,929 15,390 2022 7.6% 436,674 587,649 1,024,323 0.32 0.43 0.76 6,469 8,706 15,175 2023 3.4% 226,563 359,527 586,090 0.38 0.61 1.00 3,348 5,313 8,660 2024 7.7% 345,541 555,842 901,383 0.33 0.53 0.86 3rd 6,639 10,680 17,319 Rainy River 2019 5.5% 142,871 2,254 145,125 0.56 0.01 0.56 8,178 129 8,307 Coeur Mining, Inc. 2020 4.7% 138,485 5,462 143,947 0.59 0.02 0.62 7,498 296 7,793 2021 5.2% 142,994 5,899 148,893 0.59 0.02 0.62 8,713 359 9,072 2022 5.0% 131,384 8,208 139,592 0.56 0.03 0.60 7,366 460 7,827 2023 5.8% 127,029 12,459 139,488 0.49 0.05 0.54 7,376 723 8,099 2024 5.6% 95,031 9,329 104,359 0.42 0.04 0.46 2nd 6,051 594 6,645 Red Chris 2019 —% — — — — — — — — — Newmont Corporation 2020 —% — — — — — — — — — 2021 —% — — — — — — — — — 2022 0.5% 92,283 8,538 100,821 0.54 0.05 0.59 707 65 773 2023 0.6% 94,133 5,938 100,071 0.71 0.05 0.75 1,038 65 1,103 2024 0.4% 101,311 5,148 106,459 0.79 0.04 0.83 3rd 819 42 861 INTRODUCTION ABOUT ROYAL GOLD GOVERNANCE OUR PEOPLE OPERATORS AND COMMUNITIES INVESTMENT STEWARDSHIP APPENDICES Royal Gold | 2025-2026 Investment Stewardship Report 110
Mineral Property/Operator Year 1 Royal Gold Net GEOs 2 (%) Operator Emission Estimates 4 Operator Emission Intensity 2, 4 GHG Emissions Intensity Quartile Ranking 8 RGLD Attributed Emissions 5 Scope 1 Scope 2 Scope 1 & 2 Scope 1 Scope 2 Scope 1 & 2 Scope 1 Scope 2 Scope 1 & 2 (tCO 2 e) (tCO 2 e/GEO) (tCO 2 e) Robinson 2019 1.9% 149,061 329,614 478,675 0.64 1.42 2.07 3,276 7,244 10,519 KGHM International Ltd. 2020 2.2% 146,962 324,972 471,933 0.75 1.66 2.41 4,500 9,952 14,452 2021 1.8% 146,962 324,972 471,933 0.60 1.32 1.92 3,117 6,891 10,008 2022 1.9% 146,962 324,972 471,933 0.70 1.55 2.25 3,540 7,827 11,367 2023 1.5% 104,973 232,123 337,095 0.82 1.81 2.62 3,116 6,890 10,005 2024 2.5% 146,962 368,973 515,935 0.63 1.59 2.23 4th 4,120 10,344 14,465 Skyline 2019 0.3% NR NR NR NR NR NR NR NR NR Wolverine Fuels, LLC 2020 0.3% NR NR NR NR NR NR NR NR NR 2021 0.1% NR NR NR NR NR NR NR NR NR 2022 0.05% NR NR NR NR NR NR NR NR NR 2023 0.3% NR NR NR NR NR NR NR NR NR 2024 0.3% NR NR NR NR NR NR NR NR NR NR South Laverton 3 2019 1.1% 87,006 0.00 87,006 0.44 0.00 0.44 1,342 0 1,342 Northern Star Resources Ltd. 2020 2.2% 96,570 0.00 96,570 0.45 0.00 0.45 2,708 0 2,708 2021 1.9% 150,238 0.00 150,238 0.59 0.00 0.59 3,244 0 3,244 2022 1.3% 166,156 0.00 166,156 0.85 0.00 0.85 2,933 0 2,933 2023 1.4% 151,848 0.00 151,848 0.61 0.00 0.61 2,282 0 2,282 2024 1.4% 137,263 0.00 137,263 0.55 0.00 0.55 2nd 2,057 0 2,057 Southern Cross 2019 0.4% 40,369 57,690 98,059 0.25 0.36 0.61 269 384 653 Shandong Tianye Group 2020 0.3% 37,907 46,214 84,121 0.23 0.29 0.52 210 256 466 2021 0.3% 35,834 53,765 89,599 0.22 0.33 0.55 212 317 529 2022 0.3% 33,077 83,735 116,812 0.20 0.52 0.72 155 392 547 2023 0.3% 33,077 83,735 116,812 0.20 0.51 0.71 164 416 581 2024 0.4% 33,077 68,310 101,387 0.20 0.42 0.62 3rd 200 414 615 INTRODUCTION ABOUT ROYAL GOLD GOVERNANCE OUR PEOPLE OPERATORS AND COMMUNITIES INVESTMENT STEWARDSHIP APPENDICES Royal Gold | 2025-2026 Investment Stewardship Report 111
Mineral Property/Operator Year 1 Royal Gold Net GEOs 2 (%) Operator Emission Estimates 4 Operator Emission Intensity 2, 4 GHG Emissions Intensity Quartile Ranking 8 RGLD Attributed Emissions 5 Scope 1 Scope 2 Scope 1 & 2 Scope 1 Scope 2 Scope 1 & 2 Scope 1 Scope 2 Scope 1 & 2 (tCO 2 e) (tCO 2 e/GEO) (tCO 2 e) Voisey’s Bay 2019 2.0% 81,705 0.00 81,705 0.21 0.00 0.21 1,117 0.00 1,117 Vale S.A. 2020 1.5% 73,397 0.00 73,397 0.20 0.00 0.20 780 0.00 780 2021 2.6% 83,745 0.00 83,745 0.21 0.00 0.21 1,557 0.00 1,557 2022 1.5% 91,521 0.00 91,521 0.37 0.00 0.37 1,489 0.00 1,489 2023 0.8% 93,134 0.00 93,134 0.64 0.00 0.64 1,326 0.00 1,326 2024 1.0% 264,020 0.00 264,020 1.22 0.00 1.22 2nd (Cu) 3,290 0.00 3,290 Wassa 2019 4.4% 20,890 9,950 30,840 0.13 0.06 0.20 1,585 755 2,340 Chifeng Jilong Gold Mining Co., Ltd. 2020 5.0% 20,409 12,200 32,608 0.12 0.07 0.19 1,635 977 2,612 2021 4.9% 26,820 69,770 96,590 0.17 0.45 0.62 2,422 6,302 8,724 2022 5.2% 29,557 78,144 107,701 0.17 0.45 0.62 2,376 6,282 8,658 2023 5.2% 27,544 95,700 123,244 0.12 0.41 0.53 1,609 5,592 7,201 2024 6.3% 20,438 84,099 104,537 0.11 0.45 0.56 2nd 1,785 7,345 9,131 Wharf 2019 0.6% 33,715 37,674 71,389 0.40 0.44 0.84 668 746 1,414 Coeur Mining, Inc. 2020 0.7% 24,769 32,564 57,333 0.26 0.34 0.60 482 633 1,115 2021 0.6% 50,928 14,694 65,622 0.55 0.16 0.71 995 287 1,282 2022 0.5% 52,158 14,921 67,079 0.65 0.19 0.84 898 257 1,155 2023 0.7% 56,405 12,700 69,105 0.58 0.13 0.72 1,092 246 1,337 2024 0.5% 53,224 11,979 65,203 0.53 0.12 0.65 3rd 619 139 759 Williams 7 2019 0.6% 38,248 3,651 41,900 0.18 0.02 0.20 291 28 319 Barrick Gold Corporation 2020 0.7% 31,281 5,665 36,946 0.14 0.03 0.17 249 45 294 2021 0.4% 21,000 5,000 26,000 0.14 0.03 0.17 177 42 219 2022 0.2% 22,000 5,000 27,000 0.17 0.04 0.20 80 18 98 2023 (0.2%) 20,000 5,000 25,000 0.14 0.04 0.18 -69 -17 -86 2024 0.3% 18,000 5,000 23,000 0.13 0.04 0.16 1st 100 28 128 INTRODUCTION ABOUT ROYAL GOLD GOVERNANCE OUR PEOPLE OPERATORS AND COMMUNITIES INVESTMENT STEWARDSHIP APPENDICES Royal Gold | 2025-2026 Investment Stewardship Report 112
Mineral Property/Operator Year 1 Royal Gold Net GEOs 2 (%) Operator Emission Estimates 4 Operator Emission Intensity 2, 4 GHG Emissions Intensity Quartile Ranking 8 RGLD Attributed Emissions 5 Scope 1 Scope 2 Scope 1 & 2 Scope 1 Scope 2 Scope 1 & 2 Scope 1 Scope 2 Scope 1 & 2 (tCO 2 e) (tCO 2 e/GEO) (tCO 2 e) Xavantina 2019 —% — — — — — — — — — Ero Copper 2020 —% — — — — — — — — — 2021 1.2% 3,052 1,653 4,705 0.08 0.04 0.12 279 151 430 2022 3.1% 3,657 1,660 5,317 0.08 0.04 0.12 691 314 1,004 2023 4.1% 2,620 1,190 3,810 0.04 0.02 0.06 462 210 671 2024 5.0% 3,617 1,353 4,969 0.06 0.02 0.09 1st 820 307 1,127 Other Interests 2019 0.2% NR NR NR NR NR NR NR NR NR 2020 0.1% NR NR NR NR NR NR NR NR NR 2021 0.2% NR NR NR NR NR NR NR NR NR 2022 0.2% NR NR NR NR NR NR NR NR NR 2023 0.3% NR NR NR NR NR NR NR NR NR 2024 0.1% NR NR NR NR NR NR NR NR NR NR INTRODUCTION ABOUT ROYAL GOLD GOVERNANCE OUR PEOPLE OPERATORS AND COMMUNITIES INVESTMENT STEWARDSHIP APPENDICES Royal Gold | 2025-2026 Investment Stewardship Report 113
Portfolio Emission Intensity Summary Year 1 Royal Gold Net GEOs 2 (%) RGLD Attributed Emissions 5 Emission Intensity Industry Quartile Ranking 8 Scope 1 Scope 2 Scope 1 & 2 Scope 1 Scope 2 Scope 1 & 2 (tCO 2 e) (tCO 2 e/GEO) Properties With Emissions Estimates 2019 98.7% 161,308 62,905 223,963 0.61 0.24 0.85 3rd 2020 99.1% 154,934 54,192 209,125 0.58 0.20 0.79 3rd 2021 99.4% 180,164 36,292 216,455 0.64 0.13 0.77 3rd 2022 99.4% 155,887 38,857 194,744 0.59 0.15 0.74 3rd 2023 99.2% 158,529 37,201 195,730 0.62 0.14 0.76 3rd 2024 97.9% 158,634 53,917 212,551 0.62 0.21 0.84 3rd Properties Without Emissions Data 6 2019 1.3% 1,916 846 3,013 2020 0.9% 1,423 498 1,921 2021 0.6% 1,003 202 1,205 2022 0.6% 880 219 1,099 2023 0.8% 1,303 306 1,609 2024 2.1% 3,481 1,183 4,664 Total 2019 100% 163,224 63,751 226,976 0.61 0.24 0.85 2020 100% 156,357 54,690 211,046 0.58 0.20 0.79 2021 100% 181,167 36,494 217,660 0.64 0.13 0.77 2022 100% 156,767 39,076 195,843 0.59 0.15 0.74 2023 100% 159,832 37,507 197,339 0.62 0.14 0.76 2024 100% 162,115 55,100 217,215 0.62 0.21 0.84 INTRODUCTION ABOUT ROYAL GOLD GOVERNANCE OUR PEOPLE OPERATORS AND COMMUNITIES INVESTMENT STEWARDSHIP APPENDICES Royal Gold | 2025-2026 Investment Stewardship Report 114
1. The Company changed its fiscal year end from June 30 to December 31, effective as of December 31, 2021. Accordingly, certain amounts in this table have been adjusted to reflect unaudited calendar year information. 2. GEO) production is estimated by multiplying the number of net metal or commodity units of which we take delivery, multiplied by the following standard set of commodity prices and divided by the stated gold price, with the same metal prices used for each year for comparative purposes: $1,758/oz Au; $20.54/oz Ag; $6,185.82/t Cu; $1,826.14/lb Pb; $2,268.85/t Zn; $13,672/t Ni; $25,992/t Mo; $31,161/t Co (see page 136 for complete definition). 3. Royal Gold’s interest is either a portion of the mineral properties or part of a complex, and energy usage is assumed to be equally proportioned to all GEOs. 4. Mine site emissions estimates were compiled by Skarn Associates, and we have relied on its database for emissions presented for gold and copper mining operations. 5. Royal Gold’s attributed emissions = Site emissions x Royal Gold % of site production. 6. Emissions intensity for mineral properties that were not included in the Skarn Associates database have been assumed to be equal to the average of the portfolio. 7. Prior year production adjustments occurred in 2023, resulting in negative production. 8. Industry quartile ranking is based both on Skarn Associates’ emissions intensity curve for gold production (tCO 2 e/oz Au) and the emissions intensity curve for copper production (CO 2 e/t Cu). Operations are benchmarked against the gold production intensity curve unless otherwise indicated with the designation “(Cu)” indicating the ranking is based on the copper emissions intensity curve. 9. Scope 2 emissions are Market Based. INTRODUCTION ABOUT ROYAL GOLD GOVERNANCE OUR PEOPLE OPERATORS AND COMMUNITIES INVESTMENT STEWARDSHIP APPENDICES Royal Gold | 2025-2026 Investment Stewardship Report 115
Operator Water Consumption The following table presents water consumption and water use intensity for a majority of our revenue-generating mineral properties, as available from Skarn Associates for calendar years 2018 through 2024. The table also provides the water consumption that can be attributed to our streams and royalties and the average water intensity for our portfolio. We have estimates of consumption and water use intensity associated with about 98% of our net GEOs in each of the six years presented. Entries labeled “NR” means the data were not reported in the Skarn Associates database, and those labeled “–” are for periods when Royal Gold did not have royalty or stream revenue from the mineral property. Skarn Associates may update prior year information, which we may have presented in prior reports. We use the most current data available from Skarn Associates and adjust our presentation of data and calculations accordingly. The Operator Water Consumption table does not include assets from the Sandstorm/Horizon or Kansanshi transactions as these were not in our portfolio during 2024. Mineral Property/Operator Year 1 Royal Gold Net GEOs 2 (%) Validated Water Consumption 4 (ML) Royal Gold Attributed Water Consumption 5 Water Consumption Intensity (Validated) Water Consumption Intensity Quartile Ranking 8 (ML) (kL/GEO) (kL/t Ore Treated) (kL/GEO) (kL/t Ore Treated) Principal Properties Andacollo 2019 17.2% 8,770 1,734 38 0.52 Teck Resources Limited 2020 13.4% 9,032 1,309 37 0.46 2021 11.4% 8,896 1,518 47 0.48 2022 8.4% 9,242 1,266 57 0.54 2023 8.4% 8,732 1,192 55 0.54 2024 6.5% 8,161 886 52 0.57 4th 2nd Cortez 3 2019 4.3% 4,185 50 4 0.19 Nevada Gold Mines LLC 2020 6.1% 4,022 82 5 0.19 2021 11.0% 4,965 212 7 0.17 2022 10.6% 3,104 100 4 0.21 2023 18.8% 5,375 293 6 0.21 2024 11.3% 4,516 183 6 0.42 1st 1st Mount Milligan 2019 23.3% 6,697 1,339 21 0.41 Centerra Gold Inc. 2020 24.8% 7,333 1,571 24 0.37 2021 23.5% 8,023 1,638 25 0.38 2022 27.0% 10,427 2,346 33 0.49 2023 23.5% 8,833 2,030 33 0.41 2024 24.3% 8,900 2,139 34 0.41 4th 1st INTRODUCTION ABOUT ROYAL GOLD GOVERNANCE OUR PEOPLE OPERATORS AND COMMUNITIES INVESTMENT STEWARDSHIP APPENDICES Royal Gold | 2025-2026 Investment Stewardship Report 116
Mineral Property/Operator Year 1 Royal Gold Net GEOs 2 (%) Validated Water Consumption 4 (ML) Royal Gold Attributed Water Consumption 5 Water Consumption Intensity (Validated) Water Consumption Intensity Quartile Ranking 8 (ML) (kL/GEO) (kL/t Ore Treated) (kL/GEO) (kL/t Ore Treated) Pueblo Viejo 2019 17.3% 14,890 660 14 1.73 Barrick Gold Corporation 2020 16.9% 15,273 720 16 1.73 2021 14.1% 17,127 795 20 1.88 2022 12.4% 18,802 807 24 1.99 2023 10.6% 19,817 917 33 2.23 2024 9.6% 20,533 815 33 2.15 4th 4th Non-Principal Properties Allan/Borax 2019 0.3% NR NR NR NR Nutrien Ltd. 2020 0.3% NR NR NR NR 2021 0.3% NR NR NR NR 2022 0.3% NR NR NR NR 2023 0.3% NR NR NR NR 2024 0.3% NR NR NR NR NR NR Bald Mountain 3 2019 0.2% 824 3 4 0.05 Kinross Gold Corporation 2020 0.0% 1,281 1 7 0.07 2021 0.2% 1,771 4 9 0.09 2022 0.4% 2,317 11 11 0.15 2023 0.3% 3,224 18 20 0.19 2024 0.1% 3,059 4 17 0.17 3rd 1st Bellevue 2019 0.0% NR NR NR NR NR NR NR NR Bellevue Gold Ltd. 2020 0.0% NR NR NR NR NR NR NR NR NR NR NR NR 2021 0.0% NR NR NR NR NR NR NR NR NR NR NR NR 2022 0.0% NR NR NR NR NR NR NR NR 2023 0.0% NR NR NR NR 2024 1.1% NR NR NR NR NR NR INTRODUCTION ABOUT ROYAL GOLD GOVERNANCE OUR PEOPLE OPERATORS AND COMMUNITIES INVESTMENT STEWARDSHIP APPENDICES Royal Gold | 2025-2026 Investment Stewardship Report 117
INTRODUCTION ABOUT ROYAL GOLD GOVERNANCE OUR PEOPLE OPERATORS AND COMMUNITIES INVESTMENT STEWARDSHIP APPENDICES Mineral Property/Operator Year 1 Royal Gold Net GEOs 2 (%) Validated Water Consumption 4 (ML) Royal Gold Attributed Water Consumption 5 Water Consumption Intensity (Validated) Water Consumption Intensity Quartile Ranking 8 (ML) (kL/GEO) (kL/t Ore Treated) (kL/GEO) (kL/t Ore Treated) Canadian Malartic 3 2019 1.8% 9,858 70 15 0.47 Agnico Eagle Mines Ltd. 2020 1.6% 8,039 62 14 0.39 2021 1.5% 11,795 68 16 0.53 2022 1.0% 14,836 58 22 0.76 2023 0.3% 16,588 18 24 0.84 2024 0.1% 14,952 6 23 1 4th 3rd Celtic/Wonder North 2019 0.0% NR NR NR NR Northern Star Resources Ltd. 2020 0.0% NR NR NR NR 2021 0.0% NR NR NR NR 2022 0.0% NR NR NR NR 2023 0.0% NR NR NR NR 2024 0.1% NR NR NR NR NR NR Côté 2019 — — — — — IAMGOLD Corporation 2020 — — — — — 2021 — — — — — 2022 0.0% NR NR NR NR 2023 0.0% NR NR NR NR 2024 0.5% 4,214 26 21 0.85 NR 3rd Dolores 2019 1.9% 1,328 38 7 0.20 Pan American Silver Corporation 2020 1.5% 1,340 38 9 0.21 2021 2.0% 1,667 51 9 0.21 2022 1.9% 1,916 60 12 0.24 2023 1.6% 2,173 67 16 0.29 2024 1.1% 2,438 74 26 0.34 4th 1st Royal Gold | 2025-2026 Investment Stewardship Report 118
INTRODUCTION ABOUT ROYAL GOLD GOVERNANCE OUR PEOPLE OPERATORS AND COMMUNITIES INVESTMENT STEWARDSHIP APPENDICES Mineral Property/Operator Year 1 Royal Gold Net GEOs 2 (%) Validated Water Consumption 4 (ML) Royal Gold Attributed Water Consumption 5 Water Consumption Intensity (Validated) Water Consumption Intensity Quartile Ranking 8 (ML) (kL/GEO) (kL/t Ore Treated) (kL/GEO) (kL/t Ore Treated) Don Nicolas 3 2019 0.0% — — — — Cerrado Gold, Inc. 2020 0.4% 133 9 8 0.40 2021 0.2% 166 2 4 0.40 2022 0.2% 158 2 3 0.40 2023 0.1% 203 1 3 0.40 2024 0.4% 248 5 5 0.13 1st 1st El Limón 2019 0.6% 964 27 15 2.00 Equinox Gold 2020 0.9% 1,084 39 17 2.53 2021 1.0% 1,180 47 17 2.38 2022 1.2% 986 40 13 1.99 2023 1.1% 918 35 13 1.81 2024 1.2% 707 30 10 1.40 2nd 4th Goldstrike 3 2019 0.9% 8,985 13 5 0.56 Nevada Gold Mines LLC 2020 0.7% 11,104 13 7 0.56 (Goldstrike and Carlin were combined by Nevada Gold 2021 0.6% 13,934 16 9 0.60 Mines for reporting purposes starting in 2019 and are referred to as Carlin.) 2022 0.7% 11,157 12 7 0.57 2023 0.3% 6,725 4 5 0.57 2024 0.3% 10,933 6 9 1.01 2nd 4th Granite Creek 2019 0.0% NR NR NR NR i-80 Gold Corp. 2020 0.0% NR NR NR NR 2021 0.0% NR NR NR NR 2022 0.0% NR NR NR NR 2023 0.0% NR NR NR NR 2024 0.2% NR NR NR NR NR NR Royal Gold | 2025-2026 Investment Stewardship Report 119
INTRODUCTION ABOUT ROYAL GOLD GOVERNANCE OUR PEOPLE OPERATORS AND COMMUNITIES INVESTMENT STEWARDSHIP APPENDICES Mineral Property/Operator Year 1 Royal Gold Net GEOs 2 (%) Validated Water Consumption 4 (ML) Royal Gold Attributed Water Consumption 5 Water Consumption Intensity (Validated) Water Consumption Intensity Quartile Ranking 8 (ML) (kL/GEO) (kL/t Ore Treated) (kL/GEO) (kL/t Ore Treated) Gwalia 3 2019 1.0% 1,086 16 6 1.65 Genesis Minerals Limited 2020 0.9% 1,027 15 7 1.47 2021 0.9% 1,062 15 6 1.06 2022 0.8% 1,230 17 8 1.23 2023 0.7% 1,400 15 8 1.40 2024 0.7% 2,717 30 18 2 3rd 4th Khoemacau 2019 —% — — — — MMG Limited 2020 —% — — — — (formally Khoemacau Copper) 2021 0.7% 1,440 24 12 0.80 2022 3.1% 2,700 98 12 0.75 2023 5.4% 2,379 158 11 0.73 2024 4.3% 2,642 196 18 1 3rd 3rd King of the Hills 2019 0.4% — — — — Vault Minerals Limited 2020 0.2% NR NR NR NR 2021 0.03% NR NR NR NR 2022 0.2% 1,773 13 25.4 0.75 2023 0.8% 2,186 22 10 0.46 2024 0.9% 3,236 36 16 1 3rd 2nd LaRonde Zone 5 3 2019 0.5% 2,049 6 5 0.70 Agnico Eagle Mines Ltd. 2020 0.4% 1,872 6 5 0.70 2021 0.4% 2,072 6 5 0.70 2022 0.6% 1,917 8 5 0.68 2023 0.5% 1,632 6 5 0.61 2024 0.6% 1,010 5 3 0.35 1st 1st Royal Gold | 2025-2026 Investment Stewardship Report 120
INTRODUCTION ABOUT ROYAL GOLD GOVERNANCE OUR PEOPLE OPERATORS AND COMMUNITIES INVESTMENT STEWARDSHIP APPENDICES Mineral Property/Operator Year 1 Royal Gold Net GEOs 2 (%) Validated Water Consumption 4 (ML) Royal Gold Attributed Water Consumption 5 Water Consumption Intensity (Validated) Water Consumption Intensity Quartile Ranking 8 (ML) (kL/GEO) (kL/t Ore Treated) (kL/GEO) (kL/t Ore Treated) Leeville (North) 3 2019 0.3% 8,985 4 5 0.56 Nevada Gold Mines LLC 2020 0.3% 11,104 6 7 0.56 2021 1.0% 13,934 27 9 0.60 2022 0.9% 11,157 16 7 0.57 2023 1.1% 6,725 14 5 0.57 2024 1.3% 10,933 29 9 1.01 2nd 4th Manh Choh 2019 0.0% NR NR NR NR Kinross Gold Corporation 2020 0.0% NR NR NR NR 2021 0.0% NR NR NR NR 2022 0.0% NR NR NR NR 2023 0.0% NR NR NR NR 2024 1.7% 5,716 53 12 0.17 3rd 1st Mara Rosa 2019 0.0% NR NR NR NR Hochschild Mining plc 2020 0.0% NR NR NR NR 2021 0.0% NR NR NR NR 2022 0.0% NR NR NR NR 2023 0.0% NR NR NR NR 2024 0.7% 703 20 11 0.40 3rd 1st Marigold 3 2019 1.5% 1,624 30 7 0.06 SSR Mining Inc. 2020 1.7% 1,611 32 7 0.07 2021 1.6% 1,645 33 7 0.08 2022 1.3% 1,564 23 7 0.07 2023 1.0% 1,694 17 7 0.08 2024 1.3% 1,779 36 11 0.06 3rd 1st Royal Gold | 2025-2026 Investment Stewardship Report 121
INTRODUCTION ABOUT ROYAL GOLD GOVERNANCE OUR PEOPLE OPERATORS AND COMMUNITIES INVESTMENT STEWARDSHIP APPENDICES Mineral Property/Operator Year 1 Royal Gold Net GEOs 2 (%) Validated Water Consumption 4 (ML) Royal Gold Attributed Water Consumption 5 Water Consumption Intensity (Validated) Water Consumption Intensity Quartile Ranking 8 (ML) (kL/GEO) (kL/t Ore Treated) (kL/GEO) (kL/t Ore Treated) Meekathara 3 2019 0.7% NR NR NR NR Westgold Resources Ltd. 2020 0.8% 1,397 16 7.6 0.5 2021 0.7% 1,165 12 6 0.39 2022 0.6% 1,294 11 6 0.47 2023 0.4% 1,982 12 11 0.90 2024 0.1% 2,888 4 20 1.12 0 4th Peñasquito 2019 4.1% 37,333 615 57 1.87 Newmont Corporation 2020 7.1% 43,103 625 33 1.41 2021 8.2% 48,222 745 32 1.35 2022 7.6% 30,180 447 22 0.84 2023 3.4% 18,765 277 32 0.90 2024 7.7% 28,619 550 27 0.90 4th 3rd Rainy River 2019 5.5% 2,482 142 10 0.31 Coeur Mining, Inc. 2020 4.7% 2,399 130 10 0.27 2021 5.2% 1,696 103 7 0.18 2022 5.0% 4,657 261 20 0.54 2023 5.8% 6,024 350 23 0.69 2024 5.6% 7,648 487 34 0.85 4th 3rd Red Chris 2019 —% NR NR NR NR Newmont Corporation 2020 —% NR NR NR NR 2021 —% NR NR NR NR 2022 0.5% 21,908 168 128 2.32 2023 0.6% 19,920 220 149 2.15 2024 0.4% 13,491 109 105 2.14 4th 4th Royal Gold | 2025-2026 Investment Stewardship Report 122
INTRODUCTION ABOUT ROYAL GOLD GOVERNANCE OUR PEOPLE OPERATORS AND COMMUNITIES INVESTMENT STEWARDSHIP APPENDICES Mineral Property/Operator Year 1 Royal Gold Net GEOs 2 (%) Validated Water Consumption 4 (ML) Royal Gold Attributed Water Consumption 5 Water Consumption Intensity (Validated) Water Consumption Intensity Quartile Ranking 8 (ML) (kL/GEO) (kL/t Ore Treated) (kL/GEO) (kL/t Ore Treated) Robinson 2019 1.9% 19,409 427 84 1.37 KGHM International Ltd. 2020 2.2% 19,170 587 98 1.37 2021 1.8% 19,081 405 78 1.36 2022 1.9% 19,040 459 91 1.36 2023 1.5% 13,600 404 106 1.36 2024 2.5% 19,055 534 82 1.36 4th 4th Skyline 2019 0.3% NR NR NR NR Wolverine Fuels, LLC 2020 0.3% NR NR NR NR 2021 0.1% NR NR NR NR 2022 0.0% NR NR NR NR 2023 0.3% NR NR NR NR 2024 0.3% NR NR NR NR NR NR South Laverton 3 2019 1.1% 1,751 27 9 0.74 Northern Star Resources Ltd. 2020 2.2% 1,791 50 8 0.67 2021 1.9% 1,962 42 8 0.53 2022 1.3% 2,142 38 11 0.58 2023 1.4% 3,619 54 15 0.95 2024 1.4% 5,018 75 20 1.29 3rd 4th Southern Cross 2019 0.4% 1,172 8 7 0.50 Shandong Tianye Group 2020 0.3% 1,172 6 7 0.50 2021 0.3% 1,172 7 7 0.50 2022 0.3% 1,172 5 7 0.50 2023 0.3% 1,172 6 7 0.50 2024 0.4% 1,172 7 7 0.50 2nd 2nd Royal Gold | 2025-2026 Investment Stewardship Report 123
Mineral Property/Operator Year 1 INTRODUCTION ABOUT ROYAL GOLD GOVERNANCE OUR PEOPLE OPERATORS AND COMMUNITIES INVESTMENT STEWARDSHIP APPENDICES Royal Gold Net GEOs 2 (%) Validated Water Consumption 4 (ML) Royal Gold Attributed Water Consumption 5 Water Consumption Intensity (Validated) Water Consumption Intensity Quartile Ranking 8 (ML) (kL/GEO) (kL/t Ore Treated) (kL/GEO) (kL/t Ore Treated) Voisey’s Bay 2019 2.0% 5,280 72 14 2.50 Vale S.A. 2020 1.5% 5,280 56 14 2.93 2021 2.6% 5,280 98 13 2.56 2022 1.5% 2,583 42 10 1.55 2023 0.8% 4,540 65 31 2.58 2024 1.0% 3,951 49 18 2.20 3rd 4th Wassa 2019 4.4% 1,985 151 13 1.28 Chifeng Jilong Gold Mining Co., Ltd. 2020 5.0% 1,931 155 12 0.96 2021 4.9% 1,859 168 12 1.10 2022 5.2% 2,082 167 12 1.10 2023 5.2% 2,805 164 12 1.10 2024 6.3% 2,805 245 15 1.26 3rd 4th Wharf 2019 0.6% 837 17 10 0.20 Coeur Mining, Inc. 2020 0.7% 855 17 9 0.20 2021 0.6% 854 17 9 0.20 2022 0.5% 818 14 10 0.20 2023 0.7% 607 12 6 0.14 2024 0.5% 464 5 5 0.10 1st 1st Williams 7 2019 0.6% 1,662 13 8 0.57 Barrick Gold Corporation 2020 0.7% 2,917 23 13 1.46 2021 0.4% 1,138 10 8 0.92 2022 0.2% 1,062 4 8 0.90 2023 (0.2%) 1,101 -4 8 0.87 2024 0.3 % 1,187 7 8 0.85 2nd 3rd Royal Gold | 2025-2026 Investment Stewardship Report 124
Mineral Property/Operator Year 1 Royal Gold Net GEOs 2 (%) Validated Water Consumption 4 (ML) Royal Gold Attributed Water Consumption 5 Water Consumption Intensity (Validated) Water Consumption Intensity Quartile Ranking 8 (ML) (kL/GEO) (kL/t Ore Treated) (kL/GEO) (kL/t Ore Treated) Xavantina 2019 —% — — — — Ero Copper 2020 —% — — — — 2021 1.2% 69 6 2 0.40 2022 3.1% 76 14 2 0.40 2023 4.1% 54 10 1 0.40 2024 5.0% 64 14 1 0.43 1st 2nd Other Interests 2019 0.2% NR NR NR NR 2020 0.1% NR NR NR NR 2021 0.2% NR NR NR NR 2022 0.2% NR NR NR NR 2023 0.3% NR NR NR NR 2024 0.1% NR NR NR NR NR NR INTRODUCTION ABOUT ROYAL GOLD GOVERNANCE OUR PEOPLE OPERATORS AND COMMUNITIES INVESTMENT STEWARDSHIP APPENDICES Royal Gold | 2025-2026 Investment Stewardship Report 125
Portfolio Water Consumption Intensity Summary Year 1 Royal Gold Net GEOs 2 (%) Royal Gold Attributed Consumption 5 Consumption Intensity (Validated) Industry Quartile Ranking 8 (ML) (kL/GEO) (kL/t ore treated) (kL/GEO) (kL/t Ore Treated) Properties With Water Consumption Estimates 2019 97.9% 5,683 22 0.57 2020 99.1% 5,685 21 0.53 2021 99.4% 6,146 22 0.51 2022 99.4% 6,566 25 0.60 2023 99.2% 6,423 25 0.56 2024 97.9% 6,666 26 0.60 4th 2nd Properties Without Water Consumption Data 6 2019 2.1% 120 2020 0.9% 52 2021 0.6% 34 2022 0.6% 37 2023 0.8% 53 2024 2.1% 146 Total 2019 100.0% 5,803 22 0.57 2020 100.0% 5,737 21 0.53 2021 100.0% 6,180 22 0.51 2022 100.0% 6,603 25 0.60 2023 100.0% 6,476 25 0.56 2024 100.0% 6,812 26 0.60 1. The Company changed its fiscal year end from June 30 to December 31, effective as of December 31, 2021. Accordingly, certain amounts in this table have been adjusted to reflect unaudited calendar year information. 2. GEO production is estimated by multiplying the number of net metal or commodity units of which we take delivery, multiplied by the following standard set of commodity prices and divided by the stated gold price, with the same metal prices used for each year for comparative purposes: $1,758/oz Au; $20.54/oz Ag; $6,185.82/t Cu; $1,826.14/lb Pb; $2,268.85/t Zn; $13,672/t Ni; $25,992/t Mo; $31,161/t Co (see page 136 for complete definition). 3. Royal Gold’s interest is either a portion of the mineral properties or part of a complex, and water usage is assumed to be equally proportioned to all GEOs. 4. Mine site water consumption estimates were compiled by Skarn Associates, and we have relied on its database for emissions presented for gold and copper mining operations. 5. Royal Gold’s attributed water consumption = Site consumption x Royal Gold % of site production. 6. Water consumption for mineral properties that were not included in the Skarn Associates database have been assumed to be equal to the average of the portfolio. 7. Prior year production adjustments occurred in 2023, resulting in negative production. 8. Industry quartile ranking is based both on Skarn Associates’ water consumption intensity curves for gold production. INTRODUCTION ABOUT ROYAL GOLD GOVERNANCE OUR PEOPLE OPERATORS AND COMMUNITIES INVESTMENT STEWARDSHIP APPENDICES Royal Gold | 2025-2026 Investment Stewardship Report 126
Operator Stewardship Framework Alignment The following table highlights widely recognized international frameworks and standards to which the Operators adhere; 100% of 2025 RGLD revenue is represented in the table including Operators from the Sandstorm/Horizon and Kansanshi transactions. 1 Operator Percentage of 2025 Royal Gold Revenue WGC RGMPs ICMM Mining Association of Canada Towards Sustainable Mining United Nations Global Compact United Nations SDGs Agnico Eagle Mines Ltd. 1.20% Yes (Member) Yes (Member) Yes B2Gold 0.10% Yes (Member) Yes Barrick Gold Corporation 12.93% Yes (Member) Yes (Member) Yes (Member) Yes (Participant) Yes Bear Creek 0.30% Bellevue Gold Ltd. 0.80% Yes (Participant) Yes Blyvoor Gold 0.10% Calibre Mining Corporation (now Equinox Gold) 1.30% Yes Centerra Gold Inc. 21.80% Yes (Member) Yes Cerrado Gold, Inc. 0.10% Chifeng Jilong Gold Mining Co., Ltd. 5.05% Yes Coeur Mining, Inc. 0.70% Yes Develop Gold 0.10% Eldorado Gold 0.003% Yes (Member) Yes (Member) Yes (Participant) Yes Endeavour Mining 0.21% Yes (Member) Yes (Participant) Yes Equinox Gold 0.70% Yes (Member) Yes (Member) Yes (Participant) Yes Eris LLC 0.13% Ero Copper 2.90% Yes (Participant) Yes Excelsior Mining 0.05% First Quantum Minerals Ltd. 3.10% Yes (Member) Genesis Minerals Ltd 0.60% Glencore 0.20% Yes (Member) Yes (Member) Yes Harmony Mining Company 0.01% Yes Hecla Mining Company 0.01% Yes Hochschild Mining plc 0.40% Aligned Yes (Participant) Hudbay Minerals 0.01% Yes (Member) Yes i-80 Gold Corp. 0.50% IAMGOLD Corporation 0.80% Yes (Member) Yes (Member) KGHM International Ltd. 1.80% Yes Kinross Gold Corporation 2.10% Lundin Gold Inc. 0.30% Yes (Member) Yes (Participant) Lundin Mining 0.20% Yes (Member) Yes INTRODUCTION ABOUT ROYAL GOLD GOVERNANCE OUR PEOPLE OPERATORS AND COMMUNITIES INVESTMENT STEWARDSHIP APPENDICES Royal Gold | 2025-2026 Investment Stewardship Report 127
Operator Percentage of 2025 Royal Gold Revenue WGC RGMPs ICMM Mining Association of Canada Towards Sustainable Mining United Nations Global Compact United Nations SDGs McEwen Inc. 0.20% Yes (Member) Yes (Participant) Yes MMG Limited 4.50% Yes (Member) Yes (Member) Yes Nevada Gold Mines LLC 7.80% Yes (Member) Yes (Member) Yes (Member) Yes (Participant) Yes New Gold Inc. (now Coeur Mining) 6.90% Yes (Member) Yes (Participant) Yes Newmont Corporation 7.30% Yes (Member) Yes (Member) Yes (Member) Yes (Participant) Yes Northern Star Resources Ltd. 1.50% Yes (Participant) Yes Nutrien Ltd. 0.10% Yes Pan American Silver Corporation 0.50% Yes (Member) Yes (Member) Yes (Participant) Yes Serabi Gold 0.01% Shandong Tianye Group 0.30% SSR Mining Inc. 1.01% Yes Teck Resources Limited 8.43% Yes (Member) Yes (Member) Yes (Participant) Yes Vale S.A. 1.20% Yes (Member) Yes (Member) Yes Vault Minerals Limited 0.60% Westgold Resources Ltd. 0.10% Yes Other 0.1% Total 100.00% 1. A blank space Indicates that the company has not publicly disclosed its support for a particular standard or that the standard does not apply. INTRODUCTION ABOUT ROYAL GOLD GOVERNANCE OUR PEOPLE OPERATORS AND COMMUNITIES INVESTMENT STEWARDSHIP APPENDICES Royal Gold | 2025-2026 Investment Stewardship Report 128
GRI Index Statement of use: Royal Gold’s 2025-2026 Investment Stewardship Report has been developed with reference to the GRI Standards. GRI 1 used: GRI 1: Foundation 2021 GRI 2: General Disclosures 2-1 Organizational details About Royal Gold, p. 5 Back cover , p. 137 2-2 Entities included in the organization’s sustainability report About Royal Gold, p. 5 2-3 Reporting period, frequency and contact point About This Report, p. 6 2-4 Restatements of information Restatement of corporate emissions data as per updated emissions factors. 2-5 External assurance We have not sought external assurance for this report. 2-6 Activities, value chain and other business relationship About Royal Gold, pp. 5 – 28 2-7 Employees Our People, pp. 41 – 44 2-8 Workers who are not employees All of our workers are employees. 2-9 Governance structure and composition Corporate Governance, p. 30 2-10 Nomination and selection of the highest governance body Board of Directors’ Governance Guidelines 2-11 Chair of the highest governance body Board Composition, p. 30 2-12 Role of the highest governance body in overseeing the management of impacts Corporate Governance, p. 30 Investment Stewardship Governance, pp. 31 – 33 2-13 Delegation of responsibility for managing impacts Corporate Governance, p. 30 Investment Stewardship Governance, pp. 31 – 33 2-14 Role of the highest governance body in sustainability reporting Corporate Governance, p. 30 2-16 Communication of critical concerns Whistleblower Policy Code of Business Conduct and Ethics 2-22 Statement on sustainable development strategy A Letter From the Chief Executive Officer, p. 3 A Message From Our Chair, p. 4 GRI Disclosure Description Location in Report INTRODUCTION ABOUT ROYAL GOLD GOVERNANCE OUR PEOPLE OPERATORS AND COMMUNITIES INVESTMENT STEWARDSHIP APPENDICES Royal Gold | 2025-2026 Investment Stewardship Report 129
GRI Disclosure Description Location in Report 2-23 Policy commitments Investment Stewardship Policies, p. 34 2-29 Approach to stakeholder engagement Stakeholder and Investor Engagement, p. 26 GRI 3: Material Topics 3-1 Process to determine material topics Investment Stewardship Priorities Assessment, pp. 27 3-2 List of material topics Investment Stewardship Priorities Assessment, pp. 27 GRI 205: Anti-Corruption 3-3 Management of material topics The Anti-Corruption Policy applies to all Royal Gold employees. This policy also applies, if documented in a written agreement, to any agent, consultant, representative, broker, distributor, joint venture partner or other third party that is retained by Royal Gold to act on its behalf with regard to its business (together, “third-party contractors”). 205-2 Communication and training about anti-corruption policies and procedures The Anti-Corruption Policy applies to all Royal Gold employees. This policy also applies, if documented in a written agreement, to any agent, consultant, representative, broker, distributor, joint venture partner or other third party that is retained by Royal Gold to act on its behalf with regard to its business (together, “third-party contractors”). 205-3 Confirmed incidents of corruption and actions taken There were no incidents of corruption in 2025. GRI 207: Tax 3-3 Management of material topics Tax Policy 207-1 Approach to tax Taxes, Associations and Political Contributions, p. 40 207-2 Tax governance, control and risk management Tax Policy 207-4 Country-by-country reporting Taxes, Associations and Political Contributions, p. 40 GRI 302: Energy 3-3 Management of material topics Corporate Emissions, p. 57 Operator Performance, p. 61 Operator Energy Consumption, pp. 92 – 101 302-1 Energy consumption within the organization Corporate Emissions, p. 57 302-2 Energy consumption outside the organization Corporate Emissions, p. 57 Operator Energy Consumption, pp. 92 – 101 302-3 Energy intensity Operator Energy Consumption, pp. 92 – 101 INTRODUCTION ABOUT ROYAL GOLD GOVERNANCE OUR PEOPLE OPERATORS AND COMMUNITIES INVESTMENT STEWARDSHIP APPENDICES Royal Gold | 2025-2026 Investment Stewardship Report 130
GRI Disclosure Description Location in Report GRI 303: Water and Effluents 3-3 Management of material topics Operator Performance, p. 61 Operator Water Availability and Risk, p. 69 Operator Water Consumption Intensity, p. 69 303-5 Water consumption Operator Water Consumption Intensity, p. 69 Appendix > Operator Water Consumption, pp. 116 – 126 GRI 304: Biodiversity 3-3 Management of material topics Operator Performance, p. 61 Operator Biodiversity, pp. 73 – 74 304-4 IUCN Red List species and national conservation list species with habitats in areas affected by operations Operator Biodiversity, pp. 73 – 74 GRI 305: Emissions 3-3 Management of material topics Climate Change, pp. 56 – 60 Operator Performance, p. 61 305-1 Direct (scope 1) GHG emissions Corporate Emissions, p. 57 305-2 Energy indirect (scope 2) GHG emissions Corporate Emissions, p. 57 305-3 Other indirect (scope 3) GHG emissions Operator GHG Emissions, pp. 104 – 114 Appendix > Operator GHG Emissions, pp. 104 – 114 305-4 GHG emissions intensity Operator GHG Emission Intensity, p. 114 Appendix > Portfolio Emission Intensity Summary, p. 114 GRI 308: Supplier Environmental Assessment 3-3 Management of material topics Standards for Suppliers and Operators GRI 401: Employees 3-3 Management of material topics Talent Attraction and Retention, p. 42 401-1 New employee hires and employee turnover 2025 Employee Statistics, p. 43 INTRODUCTION ABOUT ROYAL GOLD GOVERNANCE OUR PEOPLE OPERATORS AND COMMUNITIES INVESTMENT STEWARDSHIP APPENDICES Royal Gold | 2025-2026 Investment Stewardship Report 131
GRI Disclosure Description Location in Report GRI 403: Occupational Health and Safety 3-3 Management of material topics Operator Safety, p. 72 Appendix > Corporate Performance Scorecard, p. 78 Operator Safety, p. 72 403-5 Worker training on occupational health and safety Health, Safety and Wellness, p. 44 403-9 Work-related injuries Appendix > Corporate Performance Scorecard, p. 78 Operator Safety, p. 72 GRI 413: Local Communities 3-3 Management of material topics Community Investment, p. 46 413-1 Operations with local community engagement, impact assessments and development programs Community Investment, p. 46 GRI 414: Supplier Social Assessment 3-3 Management of material topics Standards for Suppliers and Operators 414-1 New suppliers that were screened using social criteria GRI 415: Public Policy 3-3 Management of material topics Political Contributions, p. 40 Code of Business Conduct and Ethics 415-1 Political contributions Political Contributions, p. 40 INTRODUCTION ABOUT ROYAL GOLD GOVERNANCE OUR PEOPLE OPERATORS AND COMMUNITIES INVESTMENT STEWARDSHIP APPENDICES Royal Gold | 2025-2026 Investment Stewardship Report 132
TCFD Index TCFD Core Element and Recommended Disclosures Reference Governance Describe the Board’s oversight of climate-related risks and opportunities. 2023 Climate Report > Board Oversight, p. 14 2023 Climate Report > Management’s Role, p. 15 Describe management’s role in assessing and managing climate-related risks and opportunities. 2023 Climate Report > Management’s Role, p. 15 Strategy Describe the climate-related risks and opportunities the organization has identified over the short, medium and long term. 2023 Climate Report > Climate Strategy, p. 17 2023 Climate Report > Climate-Related Opportunities, p. 33 2023 Climate Report > Risk Assessment Time Frames, p. 40 2023 Climate Report > Risk Drivers, pp. 41–42 Describe the impact of climate-related risks and opportunities on the organization’s businesses, strategy and financial planning. 2023 Climate Report > Strategy, pp. 24–33 Describe the resilience of the organization’s strategy, taking into consideration different climate-related scenarios, including a 2°C or lower scenario. 2023 Climate Report > Climate Scenario Analysis, pp. 18–23 2023 Climate Report > Organizational Resilience to Climate Change Impacts, pp. 34–36 Risk Management Describe the organization’s processes for identifying and assessing climate-related risks. 2023 Climate Report > Identifying and Assessing Risks, p. 38 Describe the organization’s processes for managing climate-related risks. 2023 Climate Report > Managing Risks, p. 39 Describe how processes for identifying, assessing and managing climate-related risks are integrated into the organization’s overall risk management. 2023 Climate Report > Identifying and Assessing Risks, p. 38 Investment Stewardship, pp. 55 – 76 Due Diligence and Portfolio Monitoring, pp. 35 – 38 Metrics and Targets Disclose the metrics used by the organization to assess climate-related risks and opportunities in line with its strategy and risk management process. 2023 Climate Report > Organizational Resilience to Climate Change Impacts, pp. 34–36 2023 Climate Report > Tracking our Performance, pp. 44–46 Operator Performance, p. 61 ISR Appendix > Operator Energy Consumption, pp. 92 – 101 ISR Appendix > Operator GHG Emissions, pp. 104 – 114 ISR Appendix > Operator Water Consumption, pp. 116 – 126 Disclose scope 1, scope 2 and, if appropriate, scope 3 GHG emissions and the related risks. 2023 Climate Report > Tracking our Achievements Performance, pp. 44–46 Climate Change, pp. 56 - 60 ISR Appendix > Operator GHG Emissions, pp. 104 – 114 Describe the targets used by the organization to manage climate-related risks and opportunities and performance against targets. 2025 Investment Stewardship Priorities, p. 28 Offsetting Our Corporate Emissions, p. 58 INTRODUCTION ABOUT ROYAL GOLD GOVERNANCE OUR PEOPLE OPERATORS AND COMMUNITIES INVESTMENT STEWARDSHIP APPENDICES Royal Gold | 2025-2026 Investment Stewardship Report 133
SDG Index The table below highlights our direct and indirect contributions featured in this report. Direct contributions are those that we have influenced, whereas indirect contributions are those resulting from the carbon credits we purchased or Operator initiatives that we supported. The list also features SDGs that we believe link to key achievements from our Principal Properties. Topic Operator/Agency/Institution SDG Contributions Location in Report Carbon offsets Anew Climate 3 Offsetting Our Corporate Emissions, p. 58 8 12 13 15 Mining community contributions Project C.U.R.E., Needs Assessment, Wassa Mine 3 Mining Community Contribution Highlights, pp. 47 – 50 Project C.U.R.E., Toteng Clinic Container Delivery, Khoemacau Mine 3 Project Hope, Xavantina Mine 2, 4 Local community contributions United Way of Greater Toronto 11 Local Office Community Contribution Highlights, pp. 51 – 52 Food Bank of the Rockies 2, 10 Scholarships The University of Nevada, Reno Foundation 4, 10 Future Leaders in Responsible Mining Scholarships, pp. 53 – 54 Great Basin College Foundation 4, 10 Colorado School of Mines Foundation 4, 10 Montana Technological University Foundation 4, 10 South Dakota Mines Center for Alumni Relations and Advancement 4, 10 University of British Columbia 4, 10 Academic Scholarship, p. 54 INTRODUCTION ABOUT ROYAL GOLD GOVERNANCE OUR PEOPLE OPERATORS AND COMMUNITIES INVESTMENT STEWARDSHIP APPENDICES Royal Gold | 2025-2026 Investment Stewardship Report 134
Glossary Term/Abbreviation Definition Aqueduct™ Water Risk Atlas published by the World Resources Institute CNG Committee Compensation, Nominating and Governance Committee CSA S&P Global Corporate Sustainability Assessment CSMI Consolidated Mining Standard Initiative CSRD Corporate Sustainability Reporting Directive Direct energy The energy produced and consumed by the Operator within its operations, projects and facilities; it may include energy from fuels, sunlight, wind, water, etc. and is used to run the Operator’s equipment and vehicles and to produce power and heat on-site ERM Enterprise risk management ESG Environment, social and governance GEO Gold equivalent ounce GHG Greenhouse gas GRI Global Reporting Initiative Grid factor CO 2 emission factor (tCO 2 /MWh), which is associated with each unit of electricity provided by an electricity system IBAT Integrated Biodiversity Assessment Tool ICMC International Cyanide Management Code ICMM International Council on Mining and Metals IFC International Finance Corporation Indirect energy Indirect energy: electricity, thermal or other energy sources provided by a retail provider or facility not owned or operated by the user of the energy IUCN International Union for Conservation of Nature KBA Key area of biodiversity KPI Key performance indicator Term/abbreviation Definition NGFS Network of Central Banks and Supervisors for Greening the Financial System Operators Third parties that operate mining projects of our precious metal stream and royalty interests Principal Property Properties deemed material to Royal Gold, taking into account current revenue, future revenue, mine life; typically make up at least 5% of our revenue WGC RGMPs World Gold Council Responsible Gold Mining Principles SEC Securities and Exchange Commission Scope 1 emissions Emissions from sources that Royal Gold owns or controls directly Scope 2 emissions Emissions that Royal Gold causes indirectly from the energy we purchase and use Scope 3 Investment Emissions Royal Gold segments scope 3 emissions into those arising from our direct corporate activities (which we refer to as our scope 3 corporate emissions) and those of our portfolio Operators (which we refer to as our scope 3 investment emissions). We have done this because, as a passive investor, we do not have direct influence or control over the Operator’s emissions, but we do manage and assert more control over our own direct footprint. Scope 3 Corporate Emissions Emissions that are not produced by Royal Gold and are not the result of activities from assets owned or controlled by us but by those that we are indirectly responsible for across our value chain (e.g., emissions linked to employee business travel and employee commuting) SDGs United Nations Sustainable Development Goals TCFD Task Force on Climate-related Financial Disclosures Total energy A measure of both the direct and indirect energy consumed TRIFR Total Reportable Incident Frequency Rate, which includes the number of fatalities, lost-time injuries, substitute work and other injuries requiring treatment by a medical professional per million hours worked WGC World Gold Council WRI World Resources Institute INTRODUCTION ABOUT ROYAL GOLD GOVERNANCE OUR PEOPLE OPERATORS AND COMMUNITIES INVESTMENT STEWARDSHIP APPENDICES Royal Gold | 2025-2026 Investment Stewardship Report 135
GHG Emissions Footprint Calculation Methodology Royal Gold Stream and Royalty Footprint Methodology Overview Our objective is to define the beneficial interest we receive as a stream or royalty holder in comparison to the total production from a mining operation and then aggregate our portfolio of assets using a unit of measure that normalizes commodity output and commodity price. In this manner, we can compare asset or portfolio performance over time while setting aside changes in the underlying commodity prices. We use the GEO as the standard unit of measure. We start with the commodity units of which we take delivery (in the case of streams) or the commodity units associated with our royalty payments, and by using a standard set of metal prices, we multiply the commodity units by the standard commodity price for the commodity of interest; this is then divided by the standard gold price, with the result being a GEO value. In the case of metal streams, we pay to the Operator who delivers the metal a predetermined metal price per unit, which is typically a percentage of the metal’s market price at the time of delivery; this is called the cash price. The gold stream for our Mount Milligan property uses a fixed cash price of $435 per ounce versus a percentage of the gold market price. Our beneficial interest is determined after we make our cash price payment to the Operator. Royal Gold’s Net GEOs = Σ [Metal units x (1 – Fixed cash price percentage) x Standard metal price] Standard gold price We then determine the percentage interest we receive of the full operation where the stream or royalty applies. To normalize this calculation, we convert the production from the operation of interest into GEOs, again using the same set of standard metal prices referenced at the bottom of this description. In the case of a property that produces multiple commodities, all commodities are converted to GEOs. Operator’s site production GEOs = Σ [Metal units x Standard metal price] Standard gold price Having determined both our Net GEOs and the Operator’s site production GEOs, we can then calculate Royal Gold’s percentage of site production: Royal Gold’s percentage of site production = Royal Gold’s Net GEOs Operators’s site production GEOs Assets that produce concentrates that require third-party processing can result in a period of two to six months between the time metals are reported as produced and the time Royal Gold would take delivery. Our calculations have not tried to match this timing. With Royal Gold’s percentage of site production determined, parameters such as energy consumption, GHG emissions and water consumption can then be assessed with respect to the quantity of the specified parameter attributable to us. This approach allows each stream and royalty to be systematically assessed. It allows for a determination of the energy consumption, GHG emissions or water consumption associated with beneficial interest for the portfolio over a set of years and allows us to assess intensity as measured by consumption attributed to Royal Gold divided by our net GEOs. Standard Metal Prices Gold: $1,758/oz Silver: $20.54/oz Copper: $6,186/t Lead: $1,826/t Nickel: $13,672/t Moly: $25,992/t Cobalt: $31,161/t Zinc: $2,269/t Although the standard metal prices may change in the future, we expect that all reported data would use the revised set of metal prices. Royal Gold | 2025-2026 Investment Stewardship Report INTRODUCTION ABOUT ROYAL GOLD GOVERNANCE OUR PEOPLE OPERATORS AND COMMUNITIES INVESTMENT STEWARDSHIP APPENDICES 136
1144 15th Street Suite 2500 Denver, Colorado 80202 +1 (303) 573-1660 royalgold.com