
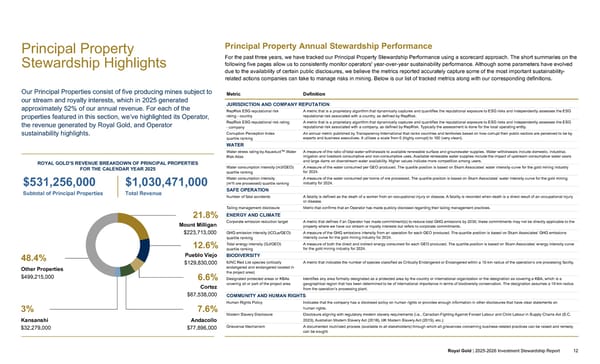
Principal Property Stewardship Highlights Our Principal Properties consist of five producing mines subject to our stream and royalty interests, which in 2025 generated approximately 52% of our annual revenue. For each of the properties featured in this section, we’ve highlighted its Operator, the revenue generated by Royal Gold, and Operator sustainability highlights. ROYAL GOLD’S REVENUE BREAKDOWN OF PRINCIPAL PROPERTIES FOR THE CALENDAR YEAR 2025 21.8% Mount Milligan $223,713,000 12.6% Pueblo Viejo $129,830,000 6.6% Cortez $67,538,000 3% Kansanshi $32,279,000 48.4% Other Properties $499,215,000 7.6% Andacollo $77,896,000 $531,256,000 $1,030,471,000 Subtotal of Principal Properties Total Revenue Principal Property Annual Stewardship Performance For the past three years, we have tracked our Principal Property Stewardship Performance using a scorecard approach. The short summaries on the following five pages allow us to consistently monitor operators' year-over-year sustainability performance. Although some parameters have evolved due to the availability of certain public disclosures, we believe the metrics reported accurately capture some of the most important sustainability- related actions companies can take to manage risks in mining. Below is our list of tracked metrics along with our corresponding definitions. Metric Definition JURISDICTION AND COMPANY REPUTATION RepRisk ESG reputational risk rating - country A metric that is a proprietary algorithm that dynamically captures and quantifies the reputational exposure to ESG risks and independently assesses the ESG reputational risk associated with a country, as defined by RepRisk. RepRisk ESG reputational risk rating - company A metric that is a proprietary algorithm that dynamically captures and quantifies the reputational exposure to ESG risks and independently assesses the ESG reputational risk associated with a company, as defined by RepRisk. Typically the assessment is done for the local operating entity. Corruption Perception Index quartile ranking An annual metric published by Transparency International that ranks countries and territories based on how corrupt their public sectors are perceived to be by experts and business executives. It utilizes a scale from 0 (highly corrupt) to 100 (very clean). WATER Water stress rating by Aqueduct™ Water Risk Atlas A measure of the ratio of total water withdrawals to available renewable surface and groundwater supplies. Water withdrawals include domestic, industrial, irrigation and livestock consumptive and non-consumptive uses. Available renewable water supplies include the impact of upstream consumptive water users and large dams on downstream water availability. Higher values indicate more competition among users. Water consumption intensity (m3/GEO) quartile ranking A measure of the water consumed per GEO produced. The quartile position is based on Skarn Associates’ water intensity curve for the gold mining industry for 2024. Water consumption intensity (m 3 /t ore processed) quartile ranking A measure of the water consumed per tonne of ore processed. The quartile position is based on Skarn Associates’ water intensity curve for the gold mining industry for 2024. SAFE OPERATION Number of fatal accidents A fatality is defined as the death of a worker from an occupational injury or disease. A fatality is recorded when death is a direct result of an occupational injury or disease. Tailing management disclosure Metric that confirms that an Operator has made publicly disclosed regarding their tailing management practices. ENERGY AND CLIMATE Corporate emission reduction target A metric that defines if an Operator has made commitment(s) to reduce total GHG emissions by 2030; these commitments may not be directly applicable to the property where we have our stream or royalty interests but refers to corporate commitments. GHG emission intensity (tCO 2 e/GEO) quartile ranking A measure of the GHG emissions intensity from an operation for each GEO produced. The quartile position is based on Skarn Associates’ GHG emissions intensity curve for the gold mining industry for 2024. Total energy intensity (GJ/GEO) quartile ranking A measure of both the direct and indirect energy consumed for each GEO produced. The quartile position is based on Skarn Associates’ energy intensity curve for the gold mining industry for 2024. BIODIVERSITY IUNC Red List species (critically endangered and endangered located in the project area) A metric that indicates the number of species classified as Critically Endangered or Endangered within a 10-km radius of the operation’s ore processing facility. Designated protected areas or KBAs covering all or part of the project area Identifies any area formally designated as a protected area by the country or international organization or the designation as covering a KBA, which is a geographical region that has been determined to be of international importance in terms of biodiversity conservation. The designation assumes a 10-km radius from the operation’s processing plant. COMMUNITY AND HUMAN RIGHTS Human Rights Policy Indicates that the company has a disclosed policy on human rights or provides enough information in other disclosures that have clear statements on human rights. Modern Slavery Disclosure Disclosure aligning with regulatory modern slavery requirements (i.e., Canadian Fighting Against Forced Labour and Child Labour in Supply Chains Act (S.C. 2023), Australian Modern Slavery Act (2018), UK Modern Slavery Act (2015), etc.). Grievance Mechanism A documented routinized process (available to all stakeholders) through which all grievances concerning business-related practices can be raised and remedy can be sought. INTRODUCTION ABOUT ROYAL GOLD GOVERNANCE OUR PEOPLE OPERATORS AND COMMUNITIES INVESTMENT STEWARDSHIP APPENDICES Royal Gold | 2025-2026 Investment Stewardship Report 12
 2025–2026 Investment Stewardship Report Page 11 Page 13