
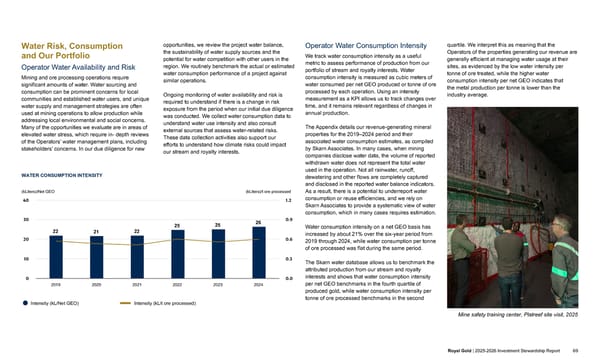
Water Risk, Consumption and Our Portfolio Operator Water Availability and Risk Mining and ore processing operations require significant amounts of water. Water sourcing and consumption can be prominent concerns for local communities and established water users, and unique water supply and management strategies are often used at mining operations to allow production while addressing local environmental and social concerns. Many of the opportunities we evaluate are in areas of elevated water stress, which require in- depth reviews of the Operators’ water management plans, including stakeholders’ concerns. In our due diligence for new opportunities, we review the project water balance, the sustainability of water supply sources and the potential for water competition with other users in the region. We routinely benchmark the actual or estimated water consumption performance of a project against similar operations. Ongoing monitoring of water availability and risk is required to understand if there is a change in risk exposure from the period when our initial due diligence was conducted. We collect water consumption data to understand water use intensity and also consult external sources that assess water-related risks. These data collection activities also support our efforts to understand how climate risks could impact our stream and royalty interests. WATER CONSUMPTION INTENSITY (kLiters)/Net GEO (kLiters)/t ore processed 22 21 22 25 25 26 2019 2020 2021 2022 2023 2024 0 10 20 30 40 0.0 0.3 0.6 0.9 1.2 🟇 Intensity (kL/Net GEO) Intensity (kL/t ore processed) Operator Water Consumption Intensity We track water consumption intensity as a useful metric to assess performance of production from our portfolio of stream and royalty interests. Water consumption intensity is measured as cubic meters of water consumed per net GEO produced or tonne of ore processed by each operation. Using an intensity measurement as a KPI allows us to track changes over time, and it remains relevant regardless of changes in annual production. The Appendix details our revenue-generating mineral properties for the 2019–2024 period and their associated water consumption estimates, as compiled by Skarn Associates. In many cases, when mining companies disclose water data, the volume of reported withdrawn water does not represent the total water used in the operation. Not all rainwater, runoff, dewatering and other flows are completely captured and disclosed in the reported water balance indicators. As a result, there is a potential to underreport water consumption or reuse efficiencies, and we rely on Skarn Associates to provide a systematic view of water consumption, which in many cases requires estimation. Water consumption intensity on a net GEO basis has increased by about 21% over the six-year period from 2019 through 2024, while water consumption per tonne of ore processed was flat during the same period. The Skarn water database allows us to benchmark the attributed production from our stream and royalty interests and shows that water consumption intensity per net GEO benchmarks in the fourth quartile of produced gold, while water consumption intensity per tonne of ore processed benchmarks in the second quartile. We interpret this as meaning that the Operators of the properties generating our revenue are generally efficient at managing water usage at their sites, as evidenced by the low water intensity per tonne of ore treated, while the higher water consumption intensity per net GEO indicates that the metal production per tonne is lower than the industry average. INTRODUCTION ABOUT ROYAL GOLD GOVERNANCE OUR PEOPLE OPERATORS AND COMMUNITIES INVESTMENT STEWARDSHIP APPENDICES Royal Gold | 2025-2026 Investment Stewardship Report 69 Mine safety training center, Platreef site visit, 2025
 2025–2026 Investment Stewardship Report Page 68 Page 70