
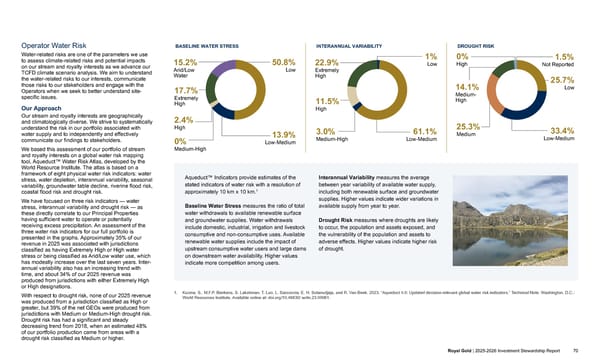
Operator Water Risk Water-related risks are one of the parameters we use to assess climate-related risks and potential impacts on our stream and royalty interests as we advance our TCFD climate scenario analysis. We aim to understand the water-related risks to our interests, communicate those risks to our stakeholders and engage with the Operators when we seek to better understand site- specific issues. Our Approach Our stream and royalty interests are geographically and climatologically diverse. We strive to systematically understand the risk in our portfolio associated with water supply and to independently and effectively communicate our findings to stakeholders. We based this assessment of our portfolio of stream and royalty interests on a global water risk mapping tool, Aqueduct™ Water Risk Atlas, developed by the World Resource Institute. The atlas is based on a framework of eight physical water risk indicators: water stress, water depletion, interannual variability, seasonal variability, groundwater table decline, riverine flood risk, coastal flood risk and drought risk. We have focused on three risk indicators — water stress, interannual variability and drought risk — as these directly correlate to our Principal Properties having sufficient water to operate or potentially receiving excess precipitation. An assessment of the three water risk indicators for our full portfolio is presented in the graphs. Approximately 35% of our revenue in 2025 was associated with jurisdictions classified as having Extremely High or High water stress or being classified as Arid/Low water use, which has modestly increase over the last seven years. Inter- annual variability also has an increasing trend with time, and about 34% of our 2025 revenue was produced from jurisdictions with either Extremely High or High designations. With respect to drought risk, none of our 2025 revenue was produced from a jurisdiction classified as High or greater, but 39% of the net GEOs were produced from jurisdictions with Medium or Medium-High drought risk. Drought risk has had a significant and steady decreasing trend from 2018, when an estimated 48% of our portfolio production came from areas with a drought risk classified as Medium or higher. BASELINE WATER STRESS 15.2% Arid/Low Water 17.7% Extremely High 2.4% High 50.8% Low 13.9% Low-Medium 0% Medium-High INTERANNUAL VARIABILITY 22.9% Extremely High 1% Low 11.5% High 61.1% Low-Medium 3.0% Medium-High DROUGHT RISK 0% High 14.1% Medium- High 25.3% Medium 1.5% Not Reported 25.7% Low 33.4% Low-Medium Aqueduct™ Indicators provide estimates of the stated indicators of water risk with a resolution of approximately 10 km x 10 km. 1 Baseline Water Stress measures the ratio of total water withdrawals to available renewable surface and groundwater supplies. Water withdrawals include domestic, industrial, irrigation and livestock consumptive and non-consumptive uses. Available renewable water supplies include the impact of upstream consumptive water users and large dams on downstream water availability. Higher values indicate more competition among users. Interannual Variability measures the average between year variability of available water supply, including both renewable surface and groundwater supplies. Higher values indicate wider variations in available supply from year to year. Drought Risk measures where droughts are likely to occur, the population and assets exposed, and the vulnerability of the population and assets to adverse effects. Higher values indicate higher risk of drought. 1. Kuzma, S., M.F.P. Bierkens, S. Lakshman, T. Luo, L. Saccoccia, E. H. Sutanudjaja, and R. Van Beek. 2023. “Aqueduct 4.0: Updated decision-relevant global water risk indicators.” Technical Note. Washington, D.C.: World Resources Institute. Available online at: doi.org/10.46830/ writn.23.00061. INTRODUCTION ABOUT ROYAL GOLD GOVERNANCE OUR PEOPLE OPERATORS AND COMMUNITIES INVESTMENT STEWARDSHIP APPENDICES Royal Gold | 2025-2026 Investment Stewardship Report 70
 2025–2026 Investment Stewardship Report Page 69 Page 71