
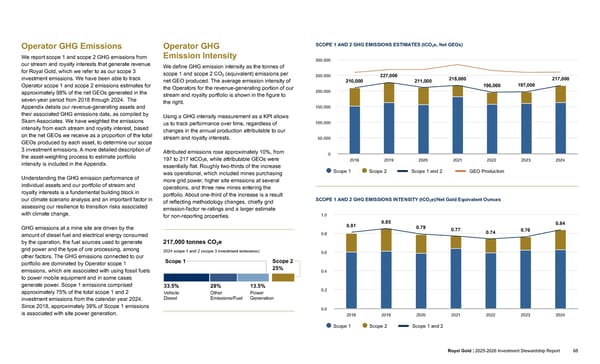
Operator GHG Emissions We report scope 1 and scope 2 GHG emissions from our stream and royalty interests that generate revenue for Royal Gold, which we refer to as our scope 3 investment emissions. We have been able to track Operator scope 1 and scope 2 emissions estimates for approximately 98% of the net GEOs generated in the seven-year period from 2018 through 2024. The Appendix details our revenue-generating assets and their associated GHG emissions data, as compiled by Skarn Associates. We have weighted the emissions intensity from each stream and royalty interest, based on the net GEOs we receive as a proportion of the total GEOs produced by each asset, to determine our scope 3 investment emissions. A more detailed description of the asset-weighting process to estimate portfolio intensity is included in the Appendix. Understanding the GHG emission performance of individual assets and our portfolio of stream and royalty interests is a fundamental building block in our climate scenario analysis and an important factor in assessing our resilience to transition risks associated with climate change. GHG emissions at a mine site are driven by the amount of diesel fuel and electrical energy consumed by the operation, the fuel sources used to generate grid power and the type of ore processing, among other factors. The GHG emissions connected to our portfolio are dominated by Operator scope 1 emissions, which are associated with using fossil fuels to power mobile equipment and in some cases generate power. Scope 1 emissions comprised approximately 75% of the total scope 1 and 2 investment emissions from the calendar year 2024. Since 2018, approximately 39% of Scope 1 emissions is associated with site power generation. Operator GHG Emission Intensity We define GHG emission intensity as the tonnes of scope 1 and scope 2 CO 2 (equivalent) emissions per net GEO produced. The average emission intensity of the Operators for the revenue-generating portion of our stream and royalty portfolio is shown in the figure to the right. Using a GHG intensity measurement as a KPI allows us to track performance over time, regardless of changes in the annual production attributable to our stream and royalty interests. Attributed emissions rose approximately 10%, from 197 to 217 ktCO ₂ e, while attributable GEOs were essentially flat. Roughly two-thirds of the increase was operational, which included mines purchasing more grid power, higher site emissions at several operations, and three new mines entering the portfolio. About one-third of the increase is a result of reflecting methodology changes, chiefly grid emission-factor re-ratings and a larger estimate for non-reporting properties. 217,000 tonnes CO 2 e 2024 scope 1 and 2 (scope 3 investment emissions) 13.5% Power Generation Scope 2 25% 28% Other Emissions/Fuel 33.5% Vehicle Diesel Scope 1 SCOPE 1 AND 2 GHG EMISSIONS ESTIMATES (tCO 2 e, Net GEOs) 210,000 227,000 211,000 218,000 196,000 197,000 217,000 2018 2019 2020 2021 2022 2023 2024 0 50,000 100,000 150,000 200,000 250,000 300,000 🟇 Scope 1 🟇 Scope 2 a Scope 1 and 2 GEO Production SCOPE 1 AND 2 GHG EMISSIONS INTENSITY (tCO 2 e)/Net Gold Equivalent Ounces 0.81 0.85 0.79 0.77 0.74 0.76 0.84 2018 2019 2020 2021 2022 2023 2024 0.0 0.2 0.4 0.6 0.8 1.0 🟇 Scope 1 🟇 Scope 2 a Scope 1 and 2 INTRODUCTION ABOUT ROYAL GOLD GOVERNANCE OUR PEOPLE OPERATORS AND COMMUNITIES INVESTMENT STEWARDSHIP APPENDICES Royal Gold | 2025-2026 Investment Stewardship Report 68
 2025–2026 Investment Stewardship Report Page 67 Page 69