
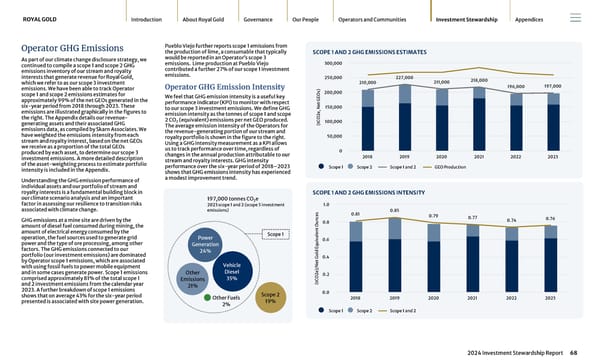
Operator GHG Emissions As part of our climate change disclosure strategy, we continued to compile a scope 1 and scope 2 GHG emissions inventory of our stream and royalty interests that generate revenue for Royal Gold, which we refer to as our scope 3 investment emissions. We have been able to track Operator scope 1 and scope 2 emissions estimates for approximately 99% of the net GEOs generated in the six-year period from 2018 through 2023. These emissions are illustrated graphically in the figures to the right. The Appendix details our revenue- generating assets and their associated GHG emissions data, as compiled by Skarn Associates. We have weighted the emissions intensity from each stream and royalty interest, based on the net GEOs we receive as a proportion of the total GEOs produced by each asset, to determine our scope 3 investment emissions. A more detailed description of the asset-weighting process to estimate portfolio intensity is included in the Appendix. Understanding the GHG emission performance of individual assets and our portfolio of stream and royalty interests is a fundamental building block in our climate scenario analysis and an important factor in assessing our resilience to transition risks associated with climate change. GHG emissions at a mine site are driven by the amount of diesel fuel consumed during mining, the amount of electrical energy consumed by the operation, the fuel sources used to generate grid power and the type of ore processing, among other factors. The GHG emissions connected to our portfolio (our investment emissions) are dominated by Operator scope 1 emissions, which are associated with using fossil fuels to power mobile equipment and in some cases generate power. Scope 1 emissions comprised approximately 81% of the total scope 1 and 2 investment emissions from the calendar year 2023. A further breakdown of scope 1 emissions shows that on average 43% for the six-year period presented is associated with site power generation. Pueblo Viejo further reports scope 1 emissions from the production of lime, a consumable that typically would be reported in an Operator’s scope 3 emissions. Lime production at Pueblo Viejo contributed a further 27% of our scope 1 investment emissions. Operator GHG Emission Intensity We feel that GHG emission intensity is a useful key performance indicator (KPI) to monitor with respect to our scope 3 investment emissions. We define GHG emission intensity as the tonnes of scope 1 and scope 2 CO 2 (equivalent) emissions per net GEO produced. The average emission intensity of the Operators for the revenue-generating portion of our stream and royalty portfolio is shown in the figure to the right. Using a GHG intensity measurement as a KPI allows us to track performance over time, regardless of changes in the annual production attributable to our stream and royalty interests. GHG intensity performance over the six-year period of 2018–2023 shows that GHG emissions intensity has experienced a modest improvement trend. Other Emissions 21% Power Generation 24% 197,000 tonnes CO 2 e 2023 scope 1 and 2 (scope 3 investment emissions) Scope 1 Other Fuels 2% Vehicle Diesel 35% Scope 2 19% SCOPE 1 AND 2 GHG EMISSIONS ESTIMATES (tCO2e, Net GEOs) 210,000 227,000 211,000 218,000 196,000 197,000 2018 2019 2020 2021 2022 2023 0 50,000 100,000 150,000 200,000 250,000 300,000 Scope 1 Scope 2 Scope 1 and 2 GEO Production SCOPE 1 AND 2 GHG EMISSIONS INTENSITY (tCO2e)/Net Gold Equivalent Ounces 0.81 0.85 0.79 0.77 0.74 0.76 2018 2019 2020 2021 2022 2023 0.0 0.2 0.4 0.6 0.8 1.0 Scope 1 Scope 2 Scope 1 and 2 ROYAL GOLD Introduction About Royal Gold Governance Our People Operators and Communities Investment Stewardship Appendices 68 2024 Investment Stewardship Report
 2024 Investment Stewardship Report Page 67 Page 69