
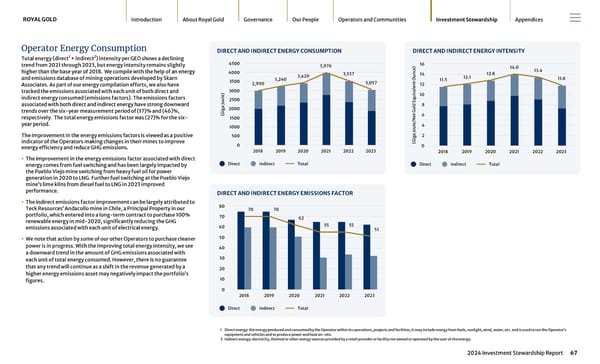
Operator Energy Consumption Total energy (direct 1 + indirect 2 ) intensity per GEO shows a declining trend from 2021 through 2023, but energy intensity remains slightly higher than the base year of 2018. We compile with the help of an energy and emissions database of mining operations developed by Skarn Associates. As part of our energy compilation efforts, we also have tracked the emissions associated with each unit of both direct and indirect energy consumed (emissions factors). The emissions factors associated with both direct and indirect energy have strong downward trends over the six-year measurement period of (17)% and (46)%, respectively. The total energy emissions factor was (27)% for the six- year period. The improvement in the energy emissions factors is viewed as a positive indicator of the Operators making changes in their mines to improve energy efficiency and reduce GHG emissions. • The improvement in the energy emissions factor associated with direct energy comes from fuel switching and has been largely impacted by the Pueblo Viejo mine switching from heavy fuel oil for power generation in 2020 to LNG. Further fuel switching at the Pueblo Viejo mine’s lime kilns from diesel fuel to LNG in 2023 improved performance. • The indirect emissions factor improvement can be largely attributed to Teck Resources’ Andacollo mine in Chile, a Principal Property in our portfolio, which entered into a long-term contract to purchase 100% renewable energy in mid-2020, significantly reducing the GHG emissions associated with each unit of electrical energy. • We note that action by some of our other Operators to purchase cleaner power is in progress. With the improving total energy intensity, we see a downward trend in the amount of GHG emissions associated with each unit of total energy consumed. However, there is no guarantee that any trend will continue as a shift in the revenue generated by a higher energy emissions asset may negatively impact the portfolio’s figures. DIRECT AND INDIRECT ENERGY CONSUMPTION (Giga Joule) 2,990 3,240 3,429 3,976 3,537 3,057 2018 2019 2020 2021 2022 2023 0 500 1000 1500 2000 2500 3000 3500 4000 4500 Direct Indirect Total DIRECT AND INDIRECT ENERGY EMISSIONS FACTOR 70 70 62 55 55 51 2018 2019 2020 2021 2022 2023 0 10 20 30 40 50 60 70 80 Direct Indirect Total DIRECT AND INDIRECT ENERGY INTENSITY (Giga Joule/Net Gold Equivalent Ounce) 11.5 12.1 12.8 14.0 13.4 11.8 2018 2019 2020 2021 2022 2023 0 2 4 6 8 10 12 14 16 Direct Indirect Total ROYAL GOLD Introduction About Royal Gold Governance Our People Operators and Communities Investment Stewardship Appendices 67 2024 Investment Stewardship Report 1 Direct energy: the energy produced and consumed by the Operator within its operations, projects and facilities; it may include energy from fuels, sunlight, wind, water, etc. and is used to run the Operator’s equipment and vehicles and to produce power and heat on-site. 2 Indirect energy: electricity, thermal or other energy sources provided by a retail provider or facility not owned or operated by the user of the energy.
 2024 Investment Stewardship Report Page 66 Page 68