
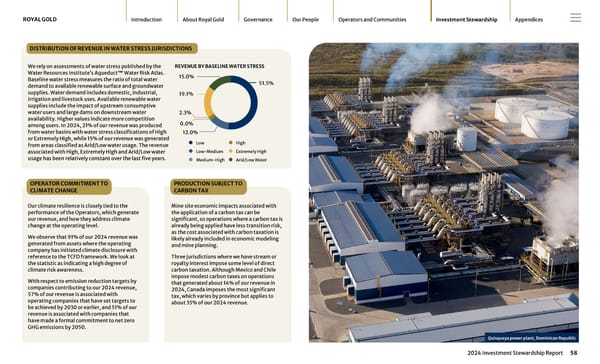
DISTRIBUTION OF REVENUE IN WATER STRESS JURISDICTIONS We rely on assessments of water stress published by the Water Resources Institute’s Aqueduct™ Water Risk Atlas. Baseline water stress measures the ratio of total water demand to available renewable surface and groundwater supplies. Water demand includes domestic, industrial, irrigation and livestock uses. Available renewable water supplies include the impact of upstream consumptive water users and large dams on downstream water availability. Higher values indicate more competition among users. In 2024, 21% of our revenue was produced from water basins with water stress classifications of High or Extremely High, while 15% of our revenue was generated from areas classified as Arid/Low water usage. The revenue associated with High, Extremely High and Arid/Low water usage has been relatively constant over the last five years. REVENUE BY BASELINE WATER STRESS Low High Low-Medium Extremely High Medium-High Arid/Low Water 51.5% 12.0% 2.3% 19.1% 0.0% 15.0% OPERATOR COMMITMENT TO CLIMATE CHANGE Our climate resilience is closely tied to the performance of the Operators, which generate our revenue, and how they address climate change at the operating level. We observe that 91% of our 2024 revenue was generated from assets where the operating company has initiated climate disclosure with reference to the TCFD framework. We look at the statistic as indicating a high degree of climate risk awareness. With respect to emission reduction targets by companies contributing to our 2024 revenue, 57% of our revenue is associated with operating companies that have set targets to be achieved by 2030 or earlier, and 51% of our revenue is associated with companies that have made a formal commitment to net zero GHG emissions by 2050. PRODUCTION SUBJECT TO CARBON TAX Mine site economic impacts associated with the application of a carbon tax can be significant, so operations where a carbon tax is already being applied have less transition risk, as the cost associated with carbon taxation is likely already included in economic modeling and mine planning. Three jurisdictions where we have stream or royalty interest impose some level of direct carbon taxation. Although Mexico and Chile impose modest carbon taxes on operations that generated about 14% of our revenue in 2024, Canada imposes the most significant tax, which varies by province but applies to about 35% of our 2024 revenue. ROYAL GOLD Introduction About Royal Gold Governance Our People Operators and Communities Investment Stewardship Appendices 2024 Investment Stewardship Report 58
 2024 Investment Stewardship Report Page 57 Page 59