
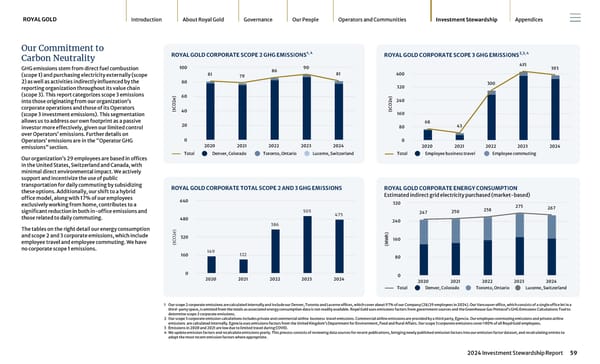
Our Commitment to Carbon Neutrality GHG emissions stem from direct fuel combustion (scope 1) and purchasing electricity externally (scope 2) as well as activities indirectly influenced by the reporting organization throughout its value chain (scope 3). This report categorizes scope 3 emissions into those originating from our organization’s corporate operations and those of its Operators (scope 3 investment emissions). This segmentation allows us to address our own footprint as a passive investor more effectively, given our limited control over Operators’ emissions. Further details on Operators’ emissions are in the “Operator GHG emissions” section. Our organization’s 29 employees are based in offices in the United States, Switzerland and Canada, with minimal direct environmental impact. We actively support and incentivize the use of public transportation for daily commuting by subsidizing these options. Additionally, our shift to a hybrid office model, along with 17% of our employees exclusively working from home, contributes to a significant reduction in both in-office emissions and those related to daily commuting. The tables on the right detail our energy consumption and scope 2 and 3 corporate emissions, which include employee travel and employee commuting. We have no corporate scope 1 emissions. ROYAL GOLD CORPORATE SCOPE 2 GHG EMISSIONS 1, 4 (tCO2e) 81 79 86 90 81 2020 2021 2022 2023 2024 0 20 40 60 80 100 Total Denver, Colorado Toronto, Ontario Lucerne, Switzerland ROYAL GOLD CORPORATE TOTAL SCOPE 2 AND 3 GHG EMISSIONS (tCO2e) 149 122 386 505 475 2020 2021 2022 2023 2024 0 160 320 480 640 ROYAL GOLD CORPORATE SCOPE 3 GHG EMISSIONS 2,3, 4 (tCO2e) 68 43 300 415 393 2020 2021 2022 2023 2024 0 80 160 240 320 400 Total Employee business travel Employee commuting ROYAL GOLD CORPORATE ENERGY CONSUMPTION Estimated indirect grid electricity purchased (market-based) ROYAL GOLD Introduction About Royal Gold Governance Our People Operators and Communities Investment Stewardship Appendices 2024 Investment Stewardship Report 59 (MWh) 247 250 258 275 267 2020 2021 2022 2023 2024 0 80 160 240 320 Total Denver, Colorado Toronto, Ontario Lucerne, Switzerland 1 Our scope 2 corporate emissions are calculated internally and include our Denver, Toronto and Lucerne offices, which cover about 97% of our Company (28/29 employees in 2024). Our Vancouver office, which consists of a single office let in a third-party space, is omitted from the totals as associated energy consumption data is not readily available. Royal Gold uses emissions factors from government sources and the Greenhouse Gas Protocol’s GHG Emissions Calculations Tool to determine scope 2 corporate emissions. 2 Our scope 3 corporate emission calculations includes private and commercial airline business travel emissions. Commercial airline emissions are provided by a third party, Egencia. Our employee commuting emissions and private airline emissions are calculated internally. Egencia uses emissions factors from the United Kingdom’s Department for Environment, Food and Rural Affairs. Our scope 3 corporate emissions cover 100% of all Royal Gold employees. 3 Emissions in 2020 and 2021 are low due to limited travel during COVID. 4 We update emission factors and recalculate emissions yearly. This process consists of reviewing data sources for recent publications, bringing newly published emission factors into our emission factor dataset, and recalculating entries to adopt the most recent emission factors where appropriate.
 2024 Investment Stewardship Report Page 58 Page 60