
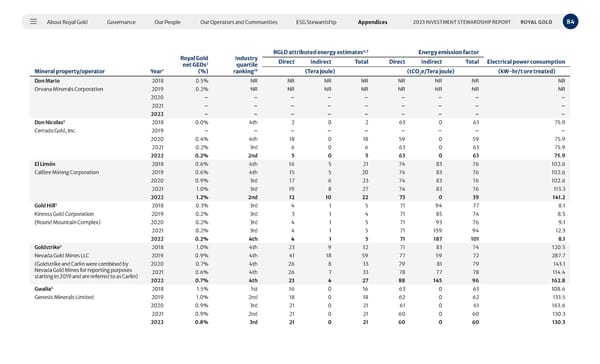
About Royal Gold Governance Our People Our Operators and Communities ESG Stewardship Appendices 84 2023 INVESTMENT STEWARDSHIP REPORT ROYAL GOLD Mineral property/operator Year 1 Royal Gold net GEOs 2 (%) Industry quartile ranking 10 RGLD attributed energy estimates 4,5 Energy emission factor Direct Indirect Total Direct Indirect Total Electrical power consumption (Tera joule) (tCO 2 e/Tera joule) (kW-hr/t ore treated) Don Mario 2018 0.5% NR NR NR NR NR NR NR NR Orvana Minerals Corporation 2019 0.2% NR NR NR NR NR NR NR NR 2020 – – – – – – – – – 2021 – – – – – – – – – 2022 – – – – – – – – – Don Nicolas 3 2018 0.0% 4th 2 0 2 63 0 63 75.9 Cerrado Gold, Inc. 2019 – – – – – – – – – 2020 0.4% 4th 18 0 18 59 0 59 75.9 2021 0.2% 3rd 6 0 6 63 0 63 75.9 2022 0.2% 2nd 5 0 5 63 0 63 75.9 El Limón 2018 0.6% 4th 16 5 21 74 83 76 102.6 Calibre Mining Corporation 2019 0.6% 4th 15 5 20 74 83 76 102.6 2020 0.9% 3rd 17 6 23 74 83 76 102.6 2021 1.0% 3rd 19 8 27 74 83 76 113.3 2022 1.2% 2nd 12 10 22 73 0 39 141.2 Gold Hill 3 2018 0.3% 3rd 4 1 5 71 94 77 8.1 Kinross Gold Corporation 2019 0.2% 3rd 3 1 4 71 85 74 8.5 (Round Mountain Complex) 2020 0.2% 3rd 4 1 5 71 93 76 9.1 2021 0.2% 3rd 4 1 5 71 159 94 12.3 2022 0.2% 4th 4 1 5 71 187 101 8.1 Goldstrike 3 2018 1.0% 4th 23 9 32 71 83 74 120.5 Nevada Gold Mines LLC 2019 0.9% 4th 41 18 59 77 59 72 287.7 (Goldstrike and Carlin were combined by Nevada Gold Mines for reporting purposes starting in 2019 and are referred to as Carlin) 2020 0.7% 4th 26 8 33 79 81 79 143.1 2021 0.6% 4th 26 7 33 78 77 78 114.4 2022 0.7% 4th 23 4 27 88 145 96 162.8 Gwalia 3 2018 1.5% 1st 16 0 16 63 0 63 108.6 Genesis Minerals Limited 2019 1.0% 2nd 18 0 18 62 0 62 133.5 2020 0.9% 3rd 21 0 21 61 0 61 163.6 2021 0.9% 2nd 21 0 21 60 0 60 130.3 2022 0.8% 3rd 21 0 21 60 0 60 130.3
 2023 Investment Stewardship Report Page 83 Page 85