
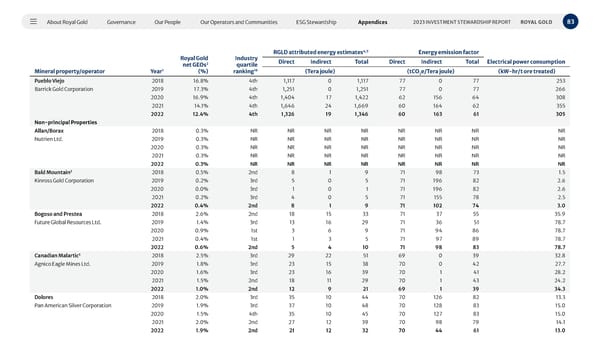
About Royal Gold Governance Our People Our Operators and Communities ESG Stewardship Appendices 83 2023 INVESTMENT STEWARDSHIP REPORT ROYAL GOLD Mineral property/operator Year 1 Royal Gold net GEOs 2 (%) Industry quartile ranking 10 RGLD attributed energy estimates 4,5 Energy emission factor Direct Indirect Total Direct Indirect Total Electrical power consumption (Tera joule) (tCO 2 e/Tera joule) (kW-hr/t ore treated) Pueblo Viejo 2018 16.8% 4th 1,117 0 1,117 77 0 77 253 Barrick Gold Corporation 2019 17.3% 4th 1,251 0 1,251 77 0 77 266 2020 16.9% 4th 1,404 17 1,422 62 156 64 308 2021 14.1% 4th 1,646 24 1,669 60 164 62 355 2022 12.4% 4th 1,326 19 1,346 60 163 61 305 Non-principal Properties Allan/Borax 2018 0.3% NR NR NR NR NR NR NR NR Nutrien Ltd. 2019 0.3% NR NR NR NR NR NR NR NR 2020 0.3% NR NR NR NR NR NR NR NR 2021 0.3% NR NR NR NR NR NR NR NR 2022 0.3% NR NR NR NR NR NR NR NR Bald Mountain 3 2018 0.5% 2nd 8 1 9 71 98 73 1.5 Kinross Gold Corporation 2019 0.2% 3rd 5 0 5 71 196 82 2.6 2020 0.0% 3rd 1 0 1 71 196 82 2.6 2021 0.2% 3rd 4 0 5 71 155 78 2.5 2022 0.4% 2nd 8 1 9 71 102 74 3.0 Bogoso and Prestea 2018 2.6% 2nd 18 15 33 71 37 55 35.9 Future Global Resources Ltd. 2019 1.4% 3rd 13 16 29 71 36 51 78.7 2020 0.9% 1st 3 6 9 71 94 86 78.7 2021 0.4% 1st 1 3 5 71 97 89 78.7 2022 0.6% 2nd 5 4 10 71 98 83 78.7 Canadian Malartic 3 2018 2.5% 3rd 29 22 51 69 0 39 32.8 Agnico Eagle Mines Ltd. 2019 1.8% 3rd 23 15 38 70 0 42 27.7 2020 1.6% 3rd 23 16 39 70 1 41 28.2 2021 1.5% 2nd 18 11 29 70 1 43 24.2 2022 1.0% 2nd 12 9 21 69 1 39 34.3 Dolores 2018 2.0% 3rd 35 10 44 70 126 82 13.3 Pan American Silver Corporation 2019 1.9% 3rd 37 10 48 70 128 83 15.0 2020 1.5% 4th 35 10 45 70 127 83 15.0 2021 2.0% 2nd 27 12 39 70 98 79 14.1 2022 1.9% 2nd 21 12 32 70 44 61 13.0
 2023 Investment Stewardship Report Page 82 Page 84