
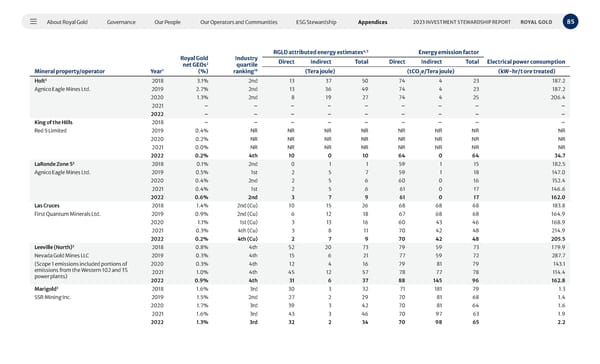
About Royal Gold Governance Our People Our Operators and Communities ESG Stewardship Appendices 85 2023 INVESTMENT STEWARDSHIP REPORT ROYAL GOLD Mineral property/operator Year 1 Royal Gold net GEOs 2 (%) Industry quartile ranking 10 RGLD attributed energy estimates 4,5 Energy emission factor Direct Indirect Total Direct Indirect Total Electrical power consumption (Tera joule) (tCO 2 e/Tera joule) (kW-hr/t ore treated) Holt 3 2018 3.1% 2nd 13 37 50 74 4 23 187.2 Agnico Eagle Mines Ltd. 2019 2.7% 2nd 13 36 49 74 4 23 187.2 2020 1.3% 2nd 8 19 27 74 4 25 206.4 2021 – – – – – – – – – 2022 – – – – – – – – – King of the Hills 2018 – – – – – – – – – Red 5 Limited 2019 0.4% NR NR NR NR NR NR NR NR 2020 0.2% NR NR NR NR NR NR NR NR 2021 0.0% NR NR NR NR NR NR NR NR 2022 0.2% 4th 10 0 10 64 0 64 34.7 LaRonde Zone 5 3 2018 0.1% 2nd 0 1 1 59 1 15 182.5 Agnico Eagle Mines Ltd. 2019 0.5% 1st 2 5 7 59 1 18 147.0 2020 0.4% 2nd 2 5 6 60 0 16 152.4 2021 0.4% 1st 2 5 6 61 0 17 146.6 2022 0.6% 2nd 3 7 9 61 0 17 162.0 Las Cruces 2018 1.4% 2nd (Cu) 10 15 26 68 68 68 183.8 First Quantum Minerals Ltd. 2019 0.9% 2nd (Cu) 6 12 18 67 68 68 164.9 2020 1.1% 1st (Cu) 3 13 16 60 43 46 168.9 2021 0.3% 4th (Cu) 3 8 11 70 42 48 214.9 2022 0.2% 4th (Cu) 2 7 9 70 42 48 205.5 Leeville (North) 3 2018 0.8% 4th 52 20 73 79 59 73 179.9 Nevada Gold Mines LLC 2019 0.3% 4th 15 6 21 77 59 72 287.7 (Scope 1 emissions included portions of emissions from the Western 102 and TS power plants) 2020 0.3% 4th 12 4 16 79 81 79 143.1 2021 1.0% 4th 45 12 57 78 77 78 114.4 2022 0.9% 4th 31 6 37 88 145 96 162.8 Marigold 3 2018 1.6% 3rd 30 3 32 71 181 79 1.3 SSR Mining Inc. 2019 1.5% 2nd 27 2 29 70 81 68 1.4 2020 1.7% 3rd 39 3 42 70 81 64 1.6 2021 1.6% 3rd 43 3 46 70 97 63 1.9 2022 1.3% 3rd 32 2 34 70 98 65 2.2
 2023 Investment Stewardship Report Page 84 Page 86