
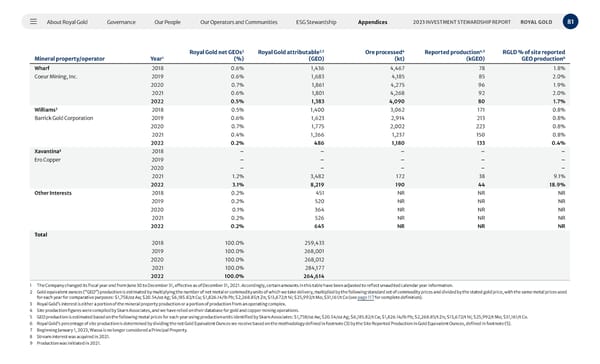
About Royal Gold Governance Our People Our Operators and Communities ESG Stewardship Appendices 81 2023 INVESTMENT STEWARDSHIP REPORT ROYAL GOLD Mineral property/operator Year 1 Royal Gold net GEOs 2 (%) Royal Gold attributable 2,5 (GEO) Ore processed 4 (kt) Reported production 4,5 (kGEO) RGLD % of site reported GEO production 6 Wharf 2018 0.6% 1,436 4,467 78 1.8% Coeur Mining, Inc. 2019 0.6% 1,683 4,185 85 2.0% 2020 0.7% 1,861 4,275 96 1.9% 2021 0.6% 1,801 4,268 92 2.0% 2022 0.5% 1,383 4,090 80 1.7% Williams 3 2018 0.5% 1,400 3,062 171 0.8% Barrick Gold Corporation 2019 0.6% 1,623 2,914 213 0.8% 2020 0.7% 1,775 2,002 223 0.8% 2021 0.4% 1,266 1,237 150 0.8% 2022 0.2% 486 1,180 133 0.4% Xavantina 8 2018 – – – – – Ero Copper 2019 – – – – – 2020 – – – – – 2021 1.2% 3,482 172 38 9.1% 2022 3.1% 8,219 190 44 18.9% Other Interests 2018 0.2% 451 NR NR NR 2019 0.2% 520 NR NR NR 2020 0.1% 364 NR NR NR 2021 0.2% 526 NR NR NR 2022 0.2% 645 NR NR NR Total 2018 100.0% 259,433 2019 100.0% 268,001 2020 100.0% 268,012 2021 100.0% 284,177 2022 100.0% 264,614 1 The Company changed its fiscal year end from June 30 to December 31, effective as of December 31, 2021. Accordingly, certain amounts in this table have been adjusted to reflect unaudited calendar year information. 2 Gold equivalent ounces (“GEO”) production is estimated by multiplying the number of net metal or commodity units of which we take delivery, multiplied by the following standard set of commodity prices and divided by the stated gold price, with the same metal prices used for each year for comparative purposes: $1,758/oz Au; $20.54/oz Ag; $6,185.82/t Cu; $1,826.14/lb Pb; $2,268.85/t Zn; $13,672/t Ni; $25,992/t Mo; $31,161/t Co (see page 117 for complete definition). 3 Royal Gold’s interest is either a portion of the mineral property production or a portion of production from an operating complex. 4 Site production figures were compiled by Skarn Associates, and we have relied on their database for gold and copper mining operations. 5 GEO production is estimated based on the following metal prices for each year using production units identified by Skarn Associates: $1,758/oz Au; $20.54/oz Ag; $6,185.82/t Cu; $1,826.14/lb Pb; $2,268.85/t Zn; $13,672/t Ni; $25,992/t Mo; $31,161/t Co. 6 Royal Gold’s percentage of site production is determined by dividing the net Gold Equivalent Ounces we receive based on the methodology defined in footnote (3) by the Site Reported Production in Gold Equivalent Ounces, defined in footnote (5). 7 Beginning January 1, 2023, Wassa is no longer considered a Principal Property. 8 Stream interest was acquired in 2021. 9 Production was initiated in 2021.
 2023 Investment Stewardship Report Page 80 Page 82