
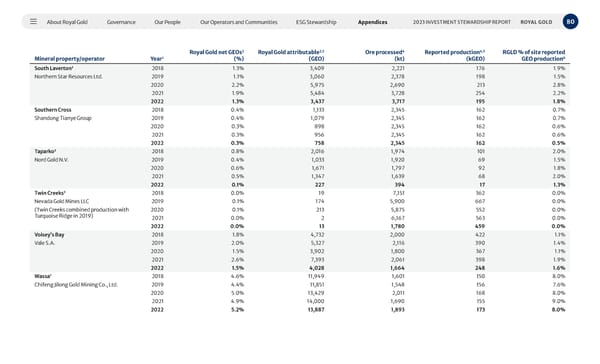
About Royal Gold Governance Our People Our Operators and Communities ESG Stewardship Appendices 80 2023 INVESTMENT STEWARDSHIP REPORT ROYAL GOLD Mineral property/operator Year 1 Royal Gold net GEOs 2 (%) Royal Gold attributable 2,5 (GEO) Ore processed 4 (kt) Reported production 4,5 (kGEO) RGLD % of site reported GEO production 6 South Laverton 3 2018 1.3% 3,409 2,221 176 1.9% Northern Star Resources Ltd. 2019 1.1% 3,060 2,378 198 1.5% 2020 2.2% 5,975 2,690 213 2.8% 2021 1.9% 5,484 3,728 254 2.2% 2022 1.3% 3,437 3,717 195 1.8% Southern Cross 2018 0.4% 1,133 2,345 162 0.7% Shandong Tianye Group 2019 0.4% 1,079 2,345 162 0.7% 2020 0.3% 898 2,345 162 0.6% 2021 0.3% 956 2,345 162 0.6% 2022 0.3% 758 2,345 162 0.5% Taparko 3 2018 0.8% 2,016 1,974 101 2.0% Nord Gold N.V. 2019 0.4% 1,033 1,920 69 1.5% 2020 0.6% 1,671 1,797 92 1.8% 2021 0.5% 1,347 1,639 68 2.0% 2022 0.1% 227 394 17 1.3% Twin Creeks 3 2018 0.0% 19 7,151 362 0.0% Nevada Gold Mines LLC 2019 0.1% 174 5,900 667 0.0% (Twin Creeks combined production with Turquoise Ridge in 2019) 2020 0.1% 213 5,875 552 0.0% 2021 0.0% 2 6,167 563 0.0% 2022 0.0% 13 1,780 459 0.0% Voisey’s Bay 2018 1.8% 4,732 2,000 422 1.1% Vale S.A. 2019 2.0% 5,327 2,116 390 1.4% 2020 1.5% 3,902 1,800 367 1.1% 2021 2.6% 7,393 2,061 398 1.9% 2022 1.5% 4,028 1,664 248 1.6% Wassa 7 2018 4.6% 11,949 1,601 150 8.0% Chifeng Jilong Gold Mining Co., Ltd. 2019 4.4% 11,851 1,548 156 7.6% 2020 5.0% 13,429 2,011 168 8.0% 2021 4.9% 14,000 1,690 155 9.0% 2022 5.2% 13,887 1,893 173 8.0%
 2023 Investment Stewardship Report Page 79 Page 81