
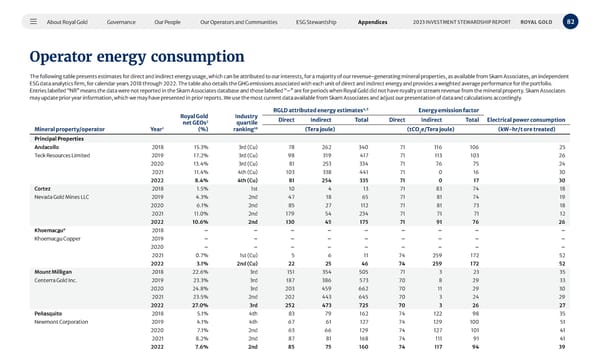
About Royal Gold Governance Our People Our Operators and Communities ESG Stewardship Appendices 82 2023 INVESTMENT STEWARDSHIP REPORT ROYAL GOLD Operator energy consumption The following table presents estimates for direct and indirect energy usage, which can be attributed to our interests, for a majority of our revenue-generating mineral properties, as available from Skarn Associates, an independent ESG data analytics firm, for calendar years 2018 through 2022. The table also details the GHG emissions associated with each unit of direct and indirect energy and provides a weighted average performance for the portfolio. Entries labelled “NR” means the data were not reported in the Skarn Associates database and those labelled “–” are for periods when Royal Gold did not have royalty or stream revenue from the mineral property. Skarn Associates may update prior year information, which we may have presented in prior reports. We use the most current data available from Skarn Associates and adjust our presentation of data and calculations accordingly. Mineral property/operator Year 1 Royal Gold net GEOs 2 (%) Industry quartile ranking 10 RGLD attributed energy estimates 4,5 Energy emission factor Direct Indirect Total Direct Indirect Total Electrical power consumption (Tera joule) (tCO 2 e/Tera joule) (kW-hr/t ore treated) Principal Properties Andacollo 2018 15.3% 3rd (Cu) 78 262 340 71 116 106 25 Teck Resources Limited 2019 17.2% 3rd (Cu) 98 319 417 71 113 103 26 2020 13.4% 3rd (Cu) 81 253 334 71 76 75 24 2021 11.4% 4th (Cu) 103 338 441 71 0 16 30 2022 8.4% 4th (Cu) 81 254 335 71 0 17 30 Cortez 2018 1.5% 1st 10 4 13 71 83 74 18 Nevada Gold Mines LLC 2019 4.3% 2nd 47 18 65 71 81 74 19 2020 6.1% 2nd 85 27 112 71 81 73 18 2021 11.0% 2nd 179 54 234 71 71 71 12 2022 10.6% 2nd 130 45 175 71 91 76 26 Khoemac a u 9 2018 – – – – – – – – – Khoemac a u Copper 2019 – – – – – – – – – 2020 – – – – – – – – – 2021 0.7% 1st (Cu) 5 6 11 74 259 172 52 2022 3.1% 2nd (Cu) 22 25 46 74 259 172 52 Mount Milligan 2018 22.6% 3rd 151 354 505 71 3 23 35 Centerra Gold Inc. 2019 23.3% 3rd 187 386 573 70 8 29 33 2020 24.8% 3rd 203 459 662 70 11 29 30 2021 23.5% 2nd 202 443 645 70 3 24 29 2022 27.0% 3rd 252 473 725 70 3 26 27 Peñasquito 2018 5.1% 4th 83 79 162 74 122 98 35 Newmont Corporation 2019 4.1% 4th 67 61 127 74 129 100 51 2020 7.1% 2nd 63 66 129 74 127 101 41 2021 8.2% 2nd 87 81 168 74 111 91 41 2022 7.6% 2nd 85 75 160 74 117 94 39
 2023 Investment Stewardship Report Page 81 Page 83