
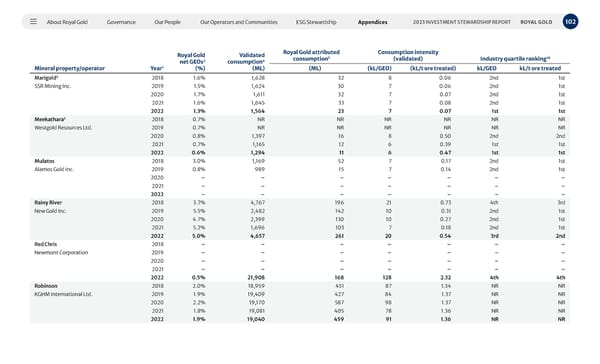
About Royal Gold Governance Our People Our Operators and Communities ESG Stewardship Appendices 102 2023 INVESTMENT STEWARDSHIP REPORT ROYAL GOLD Mineral property/operator Royal Gold net GEOs 2 (%) Validated consumption 4 (ML) Royal Gold attributed consumption 5 Consumption intensity (validated) Industry quartile ranking 10 Year 1 (ML) (kL/GEO) (kL/t ore treated) kL/GEO kL/t ore treated Marigold 3 2018 1.6% 1,628 32 8 0.06 2nd 1st SSR Mining Inc. 2019 1.5% 1,624 30 7 0.06 2nd 1st 2020 1.7% 1,611 32 7 0.07 2nd 1st 2021 1.6% 1,645 33 7 0.08 2nd 1st 2022 1.3% 1,564 23 7 0.07 1st 1st Meekathara 3 2018 0.7% NR NR NR NR NR NR Westgold Resources Ltd. 2019 0.7% NR NR NR NR NR NR 2020 0.8% 1,397 16 8 0.50 2nd 2nd 2021 0.7% 1,165 12 6 0.39 1st 1st 2022 0.6% 1,294 11 6 0.47 1st 1st Mulatos 2018 3.0% 1,169 52 7 0.17 2nd 1st Alamos Gold Inc. 2019 0.8% 989 15 7 0.14 2nd 1st 2020 – – – – – – – 2021 – – – – – – – 2022 – – – – – – – Rainy River 2018 3.7% 4,767 196 21 0.73 4th 3rd New Gold Inc. 2019 5.5% 2,482 142 10 0.31 2nd 1st 2020 4.7% 2,399 130 10 0.27 2nd 1st 2021 5.2% 1,696 103 7 0.18 2nd 1st 2022 5.0% 4,657 261 20 0.54 3rd 2nd Red Chris 2018 – – – – – – – Newmont Corporation 2019 – – – – – – – 2020 – – – – – – – 2021 – – – – – – – 2022 0.5% 21,908 168 128 2.32 4th 4th Robinson 2018 2.0% 18,959 451 87 1.34 NR NR KGHM International Ltd. 2019 1.9% 19,409 427 84 1.37 NR NR 2020 2.2% 19,170 587 98 1.37 NR NR 2021 1.8% 19,081 405 78 1.36 NR NR 2022 1.9% 19,040 459 91 1.36 NR NR
 2023 Investment Stewardship Report Page 101 Page 103