
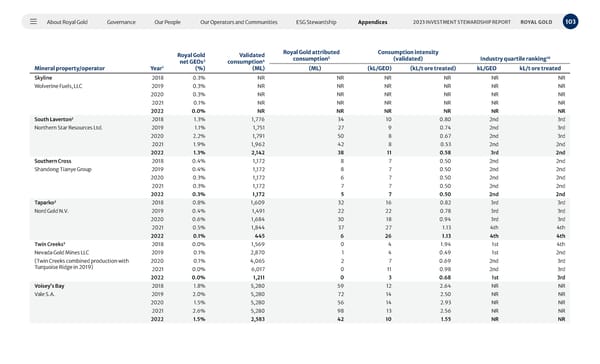
About Royal Gold Governance Our People Our Operators and Communities ESG Stewardship Appendices 103 2023 INVESTMENT STEWARDSHIP REPORT ROYAL GOLD Mineral property/operator Royal Gold net GEOs 2 (%) Validated consumption 4 (ML) Royal Gold attributed consumption 5 Consumption intensity (validated) Industry quartile ranking 10 Year 1 (ML) (kL/GEO) (kL/t ore treated) kL/GEO kL/t ore treated Skyline 2018 0.3% NR NR NR NR NR NR Wolverine Fuels, LLC 2019 0.3% NR NR NR NR NR NR 2020 0.3% NR NR NR NR NR NR 2021 0.1% NR NR NR NR NR NR 2022 0.0% NR NR NR NR NR NR South Laverton 3 2018 1.3% 1,776 34 10 0.80 2nd 3rd Northern Star Resources Ltd. 2019 1.1% 1,751 27 9 0.74 2nd 3rd 2020 2.2% 1,791 50 8 0.67 2nd 3rd 2021 1.9% 1,962 42 8 0.53 2nd 2nd 2022 1.3% 2,142 38 11 0.58 3rd 2nd Southern Cross 2018 0.4% 1,172 8 7 0.50 2nd 2nd Shandong Tianye Group 2019 0.4% 1,172 8 7 0.50 2nd 2nd 2020 0.3% 1,172 6 7 0.50 2nd 2nd 2021 0.3% 1,172 7 7 0.50 2nd 2nd 2022 0.3% 1,172 5 7 0.50 2nd 2nd Taparko 3 2018 0.8% 1,609 32 16 0.82 3rd 3rd Nord Gold N.V. 2019 0.4% 1,491 22 22 0.78 3rd 3rd 2020 0.6% 1,684 30 18 0.94 3rd 3rd 2021 0.5% 1,844 37 27 1.13 4th 4th 2022 0.1% 445 6 26 1.13 4th 4th Twin Creeks 3 2018 0.0% 1,569 0 4 1.94 1st 4th Nevada Gold Mines LLC 2019 0.1% 2,870 1 4 0.49 1st 2nd (Twin Creeks combined production with Turquoise Ridge in 2019) 2020 0.1% 4,065 2 7 0.69 2nd 3rd 2021 0.0% 6,017 0 11 0.98 2nd 3rd 2022 0.0% 1,211 0 3 0.68 1st 3rd Voisey’s Bay 2018 1.8% 5,280 59 12 2.64 NR NR Vale S.A. 2019 2.0% 5,280 72 14 2.50 NR NR 2020 1.5% 5,280 56 14 2.93 NR NR 2021 2.6% 5,280 98 13 2.56 NR NR 2022 1.5% 2,583 42 10 1.55 NR NR
 2023 Investment Stewardship Report Page 102 Page 104