
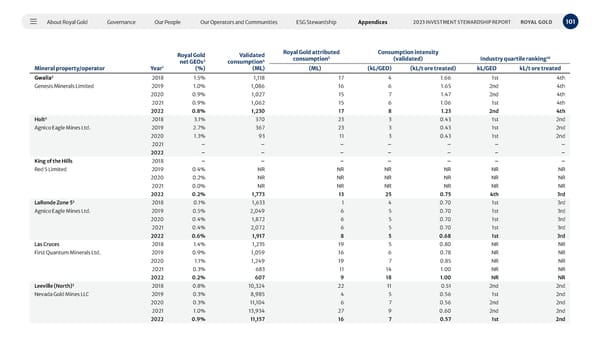
About Royal Gold Governance Our People Our Operators and Communities ESG Stewardship Appendices 101 2023 INVESTMENT STEWARDSHIP REPORT ROYAL GOLD Mineral property/operator Royal Gold net GEOs 2 (%) Validated consumption 4 (ML) Royal Gold attributed consumption 5 Consumption intensity (validated) Industry quartile ranking 10 Year 1 (ML) (kL/GEO) (kL/t ore treated) kL/GEO kL/t ore treated Gwalia 3 2018 1.5% 1,118 17 4 1.66 1st 4th Genesis Minerals Limited 2019 1.0% 1,086 16 6 1.65 2nd 4th 2020 0.9% 1,027 15 7 1.47 2nd 4th 2021 0.9% 1,062 15 6 1.06 1st 4th 2022 0.8% 1,230 17 8 1.23 2nd 4th Holt 3 2018 3.1% 370 23 3 0.43 1st 2nd Agnico Eagle Mines Ltd. 2019 2.7% 367 23 3 0.43 1st 2nd 2020 1.3% 93 11 3 0.43 1st 2nd 2021 – – – – – – – 2022 – – – – – – – King of the Hills 2018 – – – – – – – Red 5 Limited 2019 0.4% NR NR NR NR NR NR 2020 0.2% NR NR NR NR NR NR 2021 0.0% NR NR NR NR NR NR 2022 0.2% 1,773 13 25 0.75 4th 3rd LaRonde Zone 5 3 2018 0.1% 1,633 1 4 0.70 1st 3rd Agnico Eagle Mines Ltd. 2019 0.5% 2,049 6 5 0.70 1st 3rd 2020 0.4% 1,872 6 5 0.70 1st 3rd 2021 0.4% 2,072 6 5 0.70 1st 3rd 2022 0.6% 1,917 8 5 0.68 1st 3rd Las Cruces 2018 1.4% 1,235 19 5 0.80 NR NR First Quantum Minerals Ltd. 2019 0.9% 1,059 16 6 0.78 NR NR 2020 1.1% 1,249 19 7 0.85 NR NR 2021 0.3% 683 11 14 1.00 NR NR 2022 0.2% 607 9 18 1.00 NR NR Leeville (North) 3 2018 0.8% 10,324 22 11 0.51 2nd 2nd Nevada Gold Mines LLC 2019 0.3% 8,985 4 5 0.56 1st 2nd 2020 0.3% 11,104 6 7 0.56 2nd 2nd 2021 1.0% 13,934 27 9 0.60 2nd 2nd 2022 0.9% 11,157 16 7 0.57 1st 2nd
 2023 Investment Stewardship Report Page 100 Page 102