
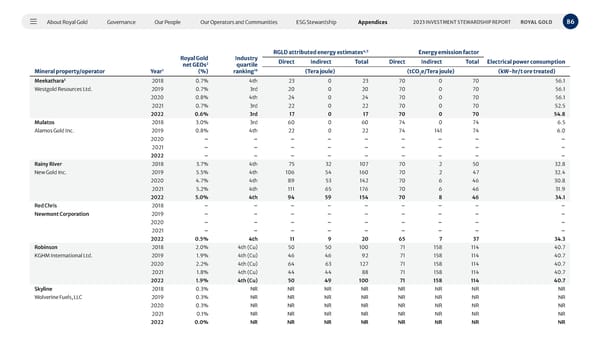
About Royal Gold Governance Our People Our Operators and Communities ESG Stewardship Appendices 86 2023 INVESTMENT STEWARDSHIP REPORT ROYAL GOLD Mineral property/operator Year 1 Royal Gold net GEOs 2 (%) Industry quartile ranking 10 RGLD attributed energy estimates 4,5 Energy emission factor Direct Indirect Total Direct Indirect Total Electrical power consumption (Tera joule) (tCO 2 e/Tera joule) (kW-hr/t ore treated) Meekathara 3 2018 0.7% 4th 23 0 23 70 0 70 56.1 Westgold Resources Ltd. 2019 0.7% 3rd 20 0 20 70 0 70 56.1 2020 0.8% 4th 24 0 24 70 0 70 56.1 2021 0.7% 3rd 22 0 22 70 0 70 52.5 2022 0.6% 3rd 17 0 17 70 0 70 54.8 Mulatos 2018 3.0% 3rd 60 0 60 74 0 74 6.5 Alamos Gold Inc. 2019 0.8% 4th 22 0 22 74 141 74 6.0 2020 – – – – – – – – – 2021 – – – – – – – – – 2022 – – – – – – – – – Rainy River 2018 3.7% 4th 75 32 107 70 2 50 32.8 New Gold Inc. 2019 5.5% 4th 106 54 160 70 2 47 32.4 2020 4.7% 4th 89 53 142 70 6 46 30.8 2021 5.2% 4th 111 65 176 70 6 46 31.9 2022 5.0% 4th 94 59 154 70 8 46 34.1 Red Chris 2018 – – – – – – – – – Newmont Corporation 2019 – – – – – – – – – 2020 – – – – – – – – – 2021 – – – – – – – – – 2022 0.5% 4th 11 9 20 65 7 37 34.3 Robinson 2018 2.0% 4th (Cu) 50 50 100 71 158 114 40.7 KGHM International Ltd. 2019 1.9% 4th (Cu) 46 46 92 71 158 114 40.7 2020 2.2% 4th (Cu) 64 63 127 71 158 114 40.7 2021 1.8% 4th (Cu) 44 44 88 71 158 114 40.7 2022 1.9% 4th (Cu) 50 49 100 71 158 114 40.7 Skyline 2018 0.3% NR NR NR NR NR NR NR NR Wolverine Fuels, LLC 2019 0.3% NR NR NR NR NR NR NR NR 2020 0.3% NR NR NR NR NR NR NR NR 2021 0.1% NR NR NR NR NR NR NR NR 2022 0.0% NR NR NR NR NR NR NR NR
 2023 Investment Stewardship Report Page 85 Page 87