
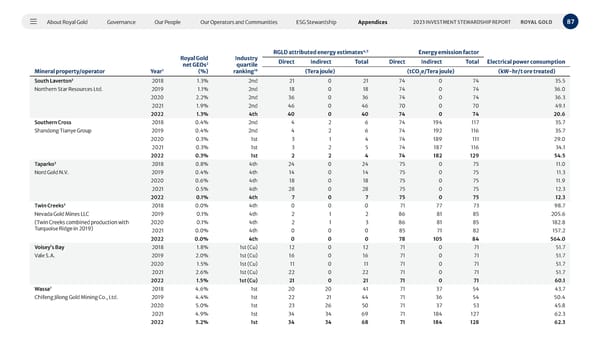
About Royal Gold Governance Our People Our Operators and Communities ESG Stewardship Appendices 87 2023 INVESTMENT STEWARDSHIP REPORT ROYAL GOLD Mineral property/operator Year 1 Royal Gold net GEOs 2 (%) Industry quartile ranking 10 RGLD attributed energy estimates 4,5 Energy emission factor Direct Indirect Total Direct Indirect Total Electrical power consumption (Tera joule) (tCO 2 e/Tera joule) (kW-hr/t ore treated) South Laverton 3 2018 1.3% 2nd 21 0 21 74 0 74 35.5 Northern Star Resources Ltd. 2019 1.1% 2nd 18 0 18 74 0 74 36.0 2020 2.2% 2nd 36 0 36 74 0 74 36.3 2021 1.9% 2nd 46 0 46 70 0 70 49.1 2022 1.3% 4th 40 0 40 74 0 74 20.6 Southern Cross 2018 0.4% 2nd 4 2 6 74 194 117 35.7 Shandong Tianye Group 2019 0.4% 2nd 4 2 6 74 192 116 35.7 2020 0.3% 1st 3 1 4 74 189 111 29.0 2021 0.3% 1st 3 2 5 74 187 116 34.1 2022 0.3% 1st 2 2 4 74 182 129 54.5 Taparko 3 2018 0.8% 4th 24 0 24 75 0 75 11.0 Nord Gold N.V. 2019 0.4% 4th 14 0 14 75 0 75 11.3 2020 0.6% 4th 18 0 18 75 0 75 11.9 2021 0.5% 4th 28 0 28 75 0 75 12.3 2022 0.1% 4th 7 0 7 75 0 75 12.3 Twin Creeks 3 2018 0.0% 4th 0 0 0 71 77 73 98.7 Nevada Gold Mines LLC 2019 0.1% 4th 2 1 2 86 81 85 205.6 (Twin Creeks combined production with Turquoise Ridge in 2019) 2020 0.1% 4th 2 1 3 86 81 85 182.8 2021 0.0% 4th 0 0 0 85 71 82 157.2 2022 0.0% 4th 0 0 0 78 105 84 564.0 Voisey’s Bay 2018 1.8% 1st (Cu) 12 0 12 71 0 71 51.7 Vale S.A. 2019 2.0% 1st (Cu) 16 0 16 71 0 71 51.7 2020 1.5% 1st (Cu) 11 0 11 71 0 71 51.7 2021 2.6% 1st (Cu) 22 0 22 71 0 71 51.7 2022 1.5% 1st (Cu) 21 0 21 71 0 71 60.1 Wassa 7 2018 4.6% 1st 20 20 41 71 37 54 43.7 Chifeng Jilong Gold Mining Co., Ltd. 2019 4.4% 1st 22 21 44 71 36 54 50.4 2020 5.0% 1st 23 26 50 71 37 53 45.8 2021 4.9% 1st 34 34 69 71 184 127 62.3 2022 5.2% 1st 34 34 68 71 184 128 62.3
 2023 Investment Stewardship Report Page 86 Page 88