
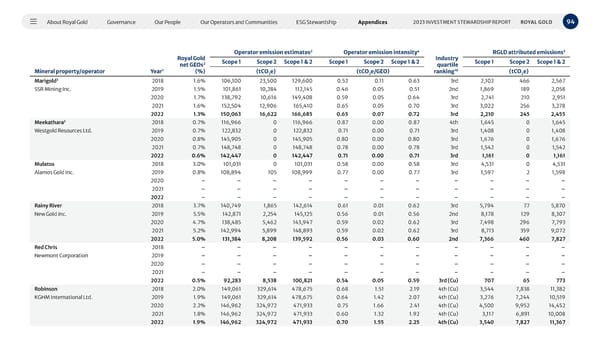
About Royal Gold Governance Our People Our Operators and Communities ESG Stewardship Appendices 94 2023 INVESTMENT STEWARDSHIP REPORT ROYAL GOLD Mineral property/operator Year 1 Royal Gold net GEOs 2 (%) Operator emission estimates 2 Operator emission intensity 4 Industry quartile ranking 10 RGLD attributed emissions 5 Scope 1 Scope 2 Scope 1 & 2 Scope 1 Scope 2 Scope 1 & 2 Scope 1 Scope 2 Scope 1 & 2 (tCO 2 e) (tCO 2 e/GEO) (tCO 2 e) Marigold 3 2018 1.6% 106,100 23,500 129,600 0.52 0.11 0.63 3rd 2,102 466 2,567 SSR Mining Inc. 2019 1.5% 101,861 10,284 112,145 0.46 0.05 0.51 2nd 1,869 189 2,058 2020 1.7% 138,792 10,616 149,408 0.59 0.05 0.64 3rd 2,741 210 2,951 2021 1.6% 152,504 12,906 165,410 0.65 0.05 0.70 3rd 3,022 256 3,278 2022 1.3% 150,063 16,622 166,685 0.65 0.07 0.72 3rd 2,210 245 2,455 Meekathara 3 2018 0.7% 116,966 0 116,966 0.87 0.00 0.87 4th 1,645 0 1,645 Westgold Resources Ltd. 2019 0.7% 122,832 0 122,832 0.71 0.00 0.71 3rd 1,408 0 1,408 2020 0.8% 145,905 0 145,905 0.80 0.00 0.80 3rd 1,676 0 1,676 2021 0.7% 148,748 0 148,748 0.78 0.00 0.78 3rd 1,542 0 1,542 2022 0.6% 142,447 0 142,447 0.71 0.00 0.71 3rd 1,161 0 1,161 Mulatos 2018 3.0% 101,031 0 101,031 0.58 0.00 0.58 3rd 4,531 0 4,531 Alamos Gold Inc. 2019 0.8% 108,894 105 108,999 0.77 0.00 0.77 3rd 1,597 2 1,598 2020 – – – – – – – – – – – 2021 – – – – – – – – – – – 2022 – – – – – – – – – – – Rainy River 2018 3.7% 140,749 1,865 142,614 0.61 0.01 0.62 3rd 5,794 77 5,870 New Gold Inc. 2019 5.5% 142,871 2,254 145,125 0.56 0.01 0.56 2nd 8,178 129 8,307 2020 4.7% 138,485 5,462 143,947 0.59 0.02 0.62 3rd 7,498 296 7,793 2021 5.2% 142,994 5,899 148,893 0.59 0.02 0.62 3rd 8,713 359 9,072 2022 5.0% 131,384 8,208 139,592 0.56 0.03 0.60 2nd 7,366 460 7,827 Red Chris 2018 – – – – – – – – – – – Newmont Corporation 2019 – – – – – – – – – – – 2020 – – – – – – – – – – – 2021 – – – – – – – – – – – 2022 0.5% 92,283 8,538 100,821 0.54 0.05 0.59 3rd (Cu) 707 65 773 Robinson 2018 2.0% 149,061 329,614 478,675 0.68 1.51 2.19 4th (Cu) 3,544 7,838 11,382 KGHM International Ltd. 2019 1.9% 149,061 329,614 478,675 0.64 1.42 2.07 4th (Cu) 3,276 7,244 10,519 2020 2.2% 146,962 324,972 471,933 0.75 1.66 2.41 4th (Cu) 4,500 9,952 14,452 2021 1.8% 146,962 324,972 471,933 0.60 1.32 1.92 4th (Cu) 3,117 6,891 10,008 2022 1.9% 146,962 324,972 471,933 0.70 1.55 2.25 4th (Cu) 3,540 7,827 11,367
 2023 Investment Stewardship Report Page 93 Page 95