
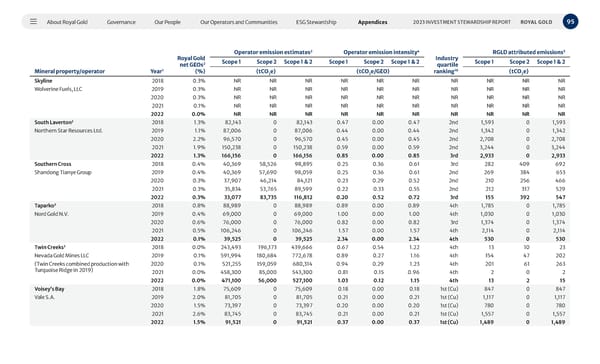
About Royal Gold Governance Our People Our Operators and Communities ESG Stewardship Appendices 95 2023 INVESTMENT STEWARDSHIP REPORT ROYAL GOLD Mineral property/operator Year 1 Royal Gold net GEOs 2 (%) Operator emission estimates 2 Operator emission intensity 4 Industry quartile ranking 10 RGLD attributed emissions 5 Scope 1 Scope 2 Scope 1 & 2 Scope 1 Scope 2 Scope 1 & 2 Scope 1 Scope 2 Scope 1 & 2 (tCO 2 e) (tCO 2 e/GEO) (tCO 2 e) Skyline 2018 0.3% NR NR NR NR NR NR NR NR NR NR Wolverine Fuels, LLC 2019 0.3% NR NR NR NR NR NR NR NR NR NR 2020 0.3% NR NR NR NR NR NR NR NR NR NR 2021 0.1% NR NR NR NR NR NR NR NR NR NR 2022 0.0% NR NR NR NR NR NR NR NR NR NR South Laverton 3 2018 1.3% 82,143 0 82,143 0.47 0.00 0.47 2nd 1,593 0 1,593 Northern Star Resources Ltd. 2019 1.1% 87,006 0 87,006 0.44 0.00 0.44 2nd 1,342 0 1,342 2020 2.2% 96,570 0 96,570 0.45 0.00 0.45 2nd 2,708 0 2,708 2021 1.9% 150,238 0 150,238 0.59 0.00 0.59 2nd 3,244 0 3,244 2022 1.3% 166,156 0 166,156 0.85 0.00 0.85 3rd 2,933 0 2,933 Southern Cross 2018 0.4% 40,369 58,526 98,895 0.25 0.36 0.61 3rd 282 409 692 Shandong Tianye Group 2019 0.4% 40,369 57,690 98,059 0.25 0.36 0.61 2nd 269 384 653 2020 0.3% 37,907 46,214 84,121 0.23 0.29 0.52 2nd 210 256 466 2021 0.3% 35,834 53,765 89,599 0.22 0.33 0.55 2nd 212 317 529 2022 0.3% 33,077 83,735 116,812 0.20 0.52 0.72 3rd 155 392 547 Taparko 3 2018 0.8% 88,989 0 88,989 0.89 0.00 0.89 4th 1,785 0 1,785 Nord Gold N.V. 2019 0.4% 69,000 0 69,000 1.00 0.00 1.00 4th 1,030 0 1,030 2020 0.6% 76,000 0 76,000 0.82 0.00 0.82 3rd 1,374 0 1,374 2021 0.5% 106,246 0 106,246 1.57 0.00 1.57 4th 2,114 0 2,114 2022 0.1% 39,525 0 39,525 2.34 0.00 2.34 4th 530 0 530 Twin Creeks 3 2018 0.0% 243,493 196,173 439,666 0.67 0.54 1.22 4th 13 10 23 Nevada Gold Mines LLC 2019 0.1% 591,994 180,684 772,678 0.89 0.27 1.16 4th 154 47 202 (Twin Creeks combined production with Turquoise Ridge in 2019) 2020 0.1% 521,255 159,059 680,314 0.94 0.29 1.23 4th 201 61 263 2021 0.0% 458,300 85,000 543,300 0.81 0.15 0.96 4th 2 0 2 2022 0.0% 471,100 56,000 527,100 1.03 0.12 1.15 4th 13 2 15 Voisey’s Bay 2018 1.8% 75,609 0 75,609 0.18 0.00 0.18 1st (Cu) 847 0 847 Vale S.A. 2019 2.0% 81,705 0 81,705 0.21 0.00 0.21 1st (Cu) 1,117 0 1,117 2020 1.5% 73,397 0 73,397 0.20 0.00 0.20 1st (Cu) 780 0 780 2021 2.6% 83,745 0 83,745 0.21 0.00 0.21 1st (Cu) 1,557 0 1,557 2022 1.5% 91,521 0 91,521 0.37 0.00 0.37 1st (Cu) 1,489 0 1,489
 2023 Investment Stewardship Report Page 94 Page 96