
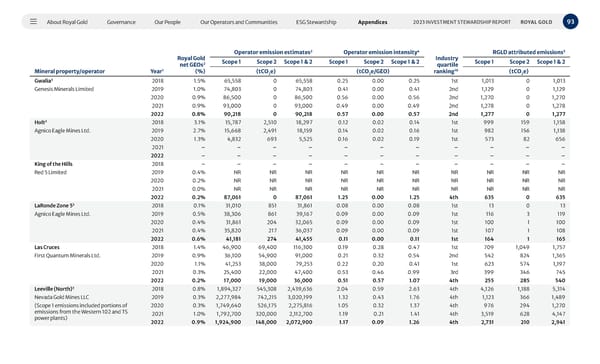
About Royal Gold Governance Our People Our Operators and Communities ESG Stewardship Appendices 93 2023 INVESTMENT STEWARDSHIP REPORT ROYAL GOLD Mineral property/operator Year 1 Royal Gold net GEOs 2 (%) Operator emission estimates 2 Operator emission intensity 4 Industry quartile ranking 10 RGLD attributed emissions 5 Scope 1 Scope 2 Scope 1 & 2 Scope 1 Scope 2 Scope 1 & 2 Scope 1 Scope 2 Scope 1 & 2 (tCO 2 e) (tCO 2 e/GEO) (tCO 2 e) Gwalia 3 2018 1.5% 65,558 0 65,558 0.25 0.00 0.25 1st 1,013 0 1,013 Genesis Minerals Limited 2019 1.0% 74,803 0 74,803 0.41 0.00 0.41 2nd 1,129 0 1,129 2020 0.9% 86,500 0 86,500 0.56 0.00 0.56 2nd 1,270 0 1,270 2021 0.9% 93,000 0 93,000 0.49 0.00 0.49 2nd 1,278 0 1,278 2022 0.8% 90,218 0 90,218 0.57 0.00 0.57 2nd 1,277 0 1,277 Holt 3 2018 3.1% 15,787 2,510 18,297 0.12 0.02 0.14 1st 999 159 1,158 Agnico Eagle Mines Ltd. 2019 2.7% 15,668 2,491 18,159 0.14 0.02 0.16 1st 982 156 1,138 2020 1.3% 4,832 693 5,525 0.16 0.02 0.19 1st 573 82 656 2021 – – – – – – – – – – – 2022 – – – – – – – – – – – King of the Hills 2018 – – – – – – – – – – – Red 5 Limited 2019 0.4% NR NR NR NR NR NR NR NR NR NR 2020 0.2% NR NR NR NR NR NR NR NR NR NR 2021 0.0% NR NR NR NR NR NR NR NR NR NR 2022 0.2% 87,061 0 87,061 1.25 0.00 1.25 4th 635 0 635 LaRonde Zone 5 3 2018 0.1% 31,010 851 31,861 0.08 0.00 0.08 1st 13 0 13 Agnico Eagle Mines Ltd. 2019 0.5% 38,306 861 39,167 0.09 0.00 0.09 1st 116 3 119 2020 0.4% 31,861 204 32,065 0.09 0.00 0.09 1st 100 1 100 2021 0.4% 35,820 217 36,037 0.09 0.00 0.09 1st 107 1 108 2022 0.6% 41,181 274 41,455 0.11 0.00 0.11 1st 164 1 165 Las Cruces 2018 1.4% 46,900 69,400 116,300 0.19 0.28 0.47 1st 709 1,049 1,757 First Quantum Minerals Ltd. 2019 0.9% 36,100 54,900 91,000 0.21 0.32 0.54 2nd 542 824 1,365 2020 1.1% 41,253 38,000 79,253 0.22 0.20 0.41 1st 623 574 1,197 2021 0.3% 25,400 22,000 47,400 0.53 0.46 0.99 3rd 399 346 745 2022 0.2% 17,000 19,000 36,000 0.51 0.57 1.07 4th 255 285 540 Leeville (North) 3 2018 0.8% 1,894,327 545,308 2,439,636 2.04 0.59 2.63 4th 4,126 1,188 5,314 Nevada Gold Mines LLC 2019 0.3% 2,277,984 742,215 3,020,199 1.32 0.43 1.76 4th 1,123 366 1,489 (Scope 1 emissions included portions of emissions from the Western 102 and TS power plants) 2020 0.3% 1,749,640 526,175 2,275,816 1.05 0.32 1.37 4th 976 294 1,270 2021 1.0% 1,792,700 320,000 2,112,700 1.19 0.21 1.41 4th 3,519 628 4,147 2022 0.9% 1,924,900 148,000 2,072,900 1.17 0.09 1.26 4th 2,731 210 2,941
 2023 Investment Stewardship Report Page 92 Page 94