
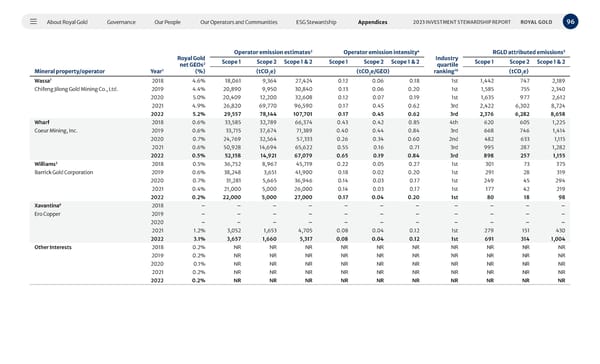
About Royal Gold Governance Our People Our Operators and Communities ESG Stewardship Appendices 96 2023 INVESTMENT STEWARDSHIP REPORT ROYAL GOLD Mineral property/operator Year 1 Royal Gold net GEOs 2 (%) Operator emission estimates 2 Operator emission intensity 4 Industry quartile ranking 10 RGLD attributed emissions 5 Scope 1 Scope 2 Scope 1 & 2 Scope 1 Scope 2 Scope 1 & 2 Scope 1 Scope 2 Scope 1 & 2 (tCO 2 e) (tCO 2 e/GEO) (tCO 2 e) Wassa 7 2018 4.6% 18,061 9,364 27,424 0.12 0.06 0.18 1st 1,442 747 2,189 Chifeng Jilong Gold Mining Co., Ltd. 2019 4.4% 20,890 9,950 30,840 0.13 0.06 0.20 1st 1,585 755 2,340 2020 5.0% 20,409 12,200 32,608 0.12 0.07 0.19 1st 1,635 977 2,612 2021 4.9% 26,820 69,770 96,590 0.17 0.45 0.62 3rd 2,422 6,302 8,724 2022 5.2% 29,557 78,144 107,701 0.17 0.45 0.62 3rd 2,376 6,282 8,658 Wharf 2018 0.6% 33,585 32,789 66,374 0.43 0.42 0.85 4th 620 605 1,225 Coeur Mining, Inc. 2019 0.6% 33,715 37,674 71,389 0.40 0.44 0.84 3rd 668 746 1,414 2020 0.7% 24,769 32,564 57,333 0.26 0.34 0.60 2nd 482 633 1,115 2021 0.6% 50,928 14,694 65,622 0.55 0.16 0.71 3rd 995 287 1,282 2022 0.5% 52,158 14,921 67,079 0.65 0.19 0.84 3rd 898 257 1,155 Williams 3 2018 0.5% 36,752 8,967 45,719 0.22 0.05 0.27 1st 301 73 375 Barrick Gold Corporation 2019 0.6% 38,248 3,651 41,900 0.18 0.02 0.20 1st 291 28 319 2020 0.7% 31,281 5,665 36,946 0.14 0.03 0.17 1st 249 45 294 2021 0.4% 21,000 5,000 26,000 0.14 0.03 0.17 1st 177 42 219 2022 0.2% 22,000 5,000 27,000 0.17 0.04 0.20 1st 80 18 98 Xavantina 8 2018 – – – – – – – – – – – Ero Copper 2019 – – – – – – – – – – – 2020 – – – – – – – – – – – 2021 1.2% 3,052 1,653 4,705 0.08 0.04 0.12 1st 279 151 430 2022 3.1% 3,657 1,660 5,317 0.08 0.04 0.12 1st 691 314 1,004 Other Interests 2018 0.2% NR NR NR NR NR NR NR NR NR NR 2019 0.2% NR NR NR NR NR NR NR NR NR NR 2020 0.1% NR NR NR NR NR NR NR NR NR NR 2021 0.2% NR NR NR NR NR NR NR NR NR NR 2022 0.2% NR NR NR NR NR NR NR NR NR NR
 2023 Investment Stewardship Report Page 95 Page 97