
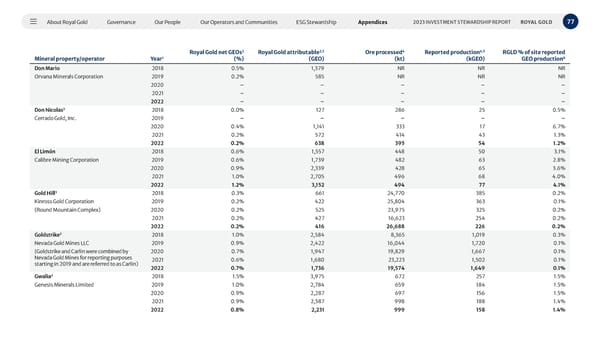
About Royal Gold Governance Our People Our Operators and Communities ESG Stewardship Appendices 77 2023 INVESTMENT STEWARDSHIP REPORT ROYAL GOLD Mineral property/operator Year 1 Royal Gold net GEOs 2 (%) Royal Gold attributable 2,5 (GEO) Ore processed 4 (kt) Reported production 4,5 (kGEO) RGLD % of site reported GEO production 6 Don Mario 2018 0.5% 1,379 NR NR NR Orvana Minerals Corporation 2019 0.2% 585 NR NR NR 2020 – – – – – 2021 – – – – – 2022 – – – – – Don Nicolas 3 2018 0.0% 127 286 25 0.5% Cerrado Gold, Inc. 2019 – – – – – 2020 0.4% 1,141 333 17 6.7% 2021 0.2% 572 414 43 1.3% 2022 0.2% 638 395 54 1.2% El Limón 2018 0.6% 1,557 448 50 3.1% Calibre Mining Corporation 2019 0.6% 1,739 482 63 2.8% 2020 0.9% 2,339 428 65 3.6% 2021 1.0% 2,705 496 68 4.0% 2022 1.2% 3,152 494 77 4.1% Gold Hill 3 2018 0.3% 661 24,770 385 0.2% Kinross Gold Corporation 2019 0.2% 422 25,804 363 0.1% (Round Mountain Complex) 2020 0.2% 525 23,975 325 0.2% 2021 0.2% 427 16,623 254 0.2% 2022 0.2% 416 26,688 226 0.2% Goldstrike 3 2018 1.0% 2,584 8,365 1,019 0.3% Nevada Gold Mines LLC 2019 0.9% 2,422 16,044 1,720 0.1% (Goldstrike and Carlin were combined by Nevada Gold Mines for reporting purposes starting in 2019 and are referred to as Carlin) 2020 0.7% 1,947 19,829 1,667 0.1% 2021 0.6% 1,680 23,223 1,502 0.1% 2022 0.7% 1,736 19,574 1,649 0.1% Gwalia 3 2018 1.5% 3,975 672 257 1.5% Genesis Minerals Limited 2019 1.0% 2,784 659 184 1.5% 2020 0.9% 2,287 697 156 1.5% 2021 0.9% 2,587 998 188 1.4% 2022 0.8% 2,231 999 158 1.4%
 2023 Investment Stewardship Report Page 76 Page 78