
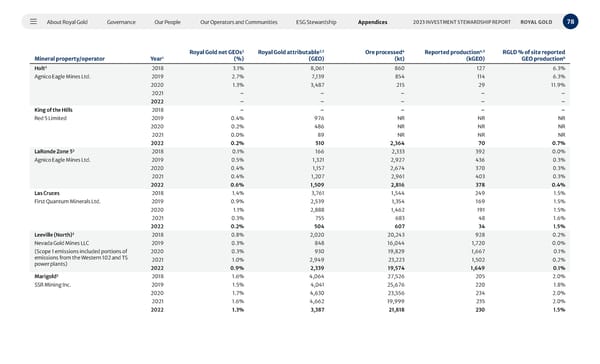
About Royal Gold Governance Our People Our Operators and Communities ESG Stewardship Appendices 78 2023 INVESTMENT STEWARDSHIP REPORT ROYAL GOLD Mineral property/operator Year 1 Royal Gold net GEOs 2 (%) Royal Gold attributable 2,5 (GEO) Ore processed 4 (kt) Reported production 4,5 (kGEO) RGLD % of site reported GEO production 6 Holt 3 2018 3.1% 8,061 860 127 6.3% Agnico Eagle Mines Ltd. 2019 2.7% 7,139 854 114 6.3% 2020 1.3% 3,487 215 29 11.9% 2021 – – – – – 2022 – – – – – King of the Hills 2018 – – – – – Red 5 Limited 2019 0.4% 976 NR NR NR 2020 0.2% 486 NR NR NR 2021 0.0% 89 NR NR NR 2022 0.2% 510 2,364 70 0.7% LaRonde Zone 5 3 2018 0.1% 166 2,333 392 0.0% Agnico Eagle Mines Ltd. 2019 0.5% 1,321 2,927 436 0.3% 2020 0.4% 1,157 2,674 370 0.3% 2021 0.4% 1,207 2,961 403 0.3% 2022 0.6% 1,509 2,816 378 0.4% Las Cruces 2018 1.4% 3,761 1,544 249 1.5% First Quantum Minerals Ltd. 2019 0.9% 2,539 1,354 169 1.5% 2020 1.1% 2,888 1,462 191 1.5% 2021 0.3% 755 683 48 1.6% 2022 0.2% 504 607 34 1.5% Leeville (North) 3 2018 0.8% 2,020 20,243 928 0.2% Nevada Gold Mines LLC 2019 0.3% 848 16,044 1,720 0.0% (Scope 1 emissions included portions of emissions from the Western 102 and TS power plants) 2020 0.3% 930 19,829 1,667 0.1% 2021 1.0% 2,949 23,223 1,502 0.2% 2022 0.9% 2,339 19,574 1,649 0.1% Marigold 3 2018 1.6% 4,064 27,526 205 2.0% SSR Mining Inc. 2019 1.5% 4,041 25,676 220 1.8% 2020 1.7% 4,630 23,556 234 2.0% 2021 1.6% 4,662 19,999 235 2.0% 2022 1.3% 3,387 21,818 230 1.5%
 2023 Investment Stewardship Report Page 77 Page 79