
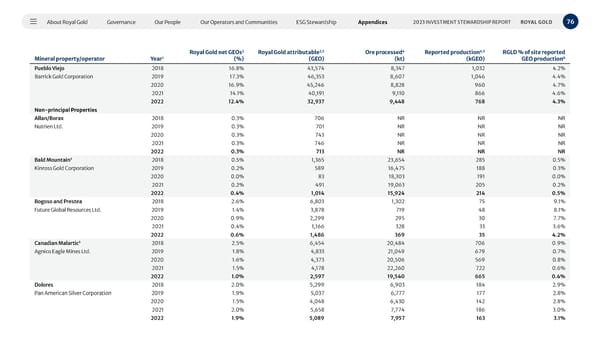
About Royal Gold Governance Our People Our Operators and Communities ESG Stewardship Appendices 76 2023 INVESTMENT STEWARDSHIP REPORT ROYAL GOLD Mineral property/operator Year 1 Royal Gold net GEOs 2 (%) Royal Gold attributable 2,5 (GEO) Ore processed 4 (kt) Reported production 4,5 (kGEO) RGLD % of site reported GEO production 6 Pueblo Viejo 2018 16.8% 43,574 8,347 1,032 4.2% Barrick Gold Corporation 2019 17.3% 46,353 8,607 1,046 4.4% 2020 16.9% 45,246 8,828 960 4.7% 2021 14.1% 40,191 9,110 866 4.6% 2022 12.4% 32,937 9,448 768 4.3% Non-principal Properties Allan/Borax 2018 0.3% 706 NR NR NR Nutrien Ltd. 2019 0.3% 701 NR NR NR 2020 0.3% 743 NR NR NR 2021 0.3% 746 NR NR NR 2022 0.3% 713 NR NR NR Bald Mountain 3 2018 0.5% 1,365 23,654 285 0.5% Kinross Gold Corporation 2019 0.2% 589 16,475 188 0.3% 2020 0.0% 83 18,303 191 0.0% 2021 0.2% 491 19,063 205 0.2% 2022 0.4% 1,014 15,924 214 0.5% Bogoso and Prestea 2018 2.6% 6,803 1,302 75 9.1% Future Global Resources Ltd. 2019 1.4% 3,878 719 48 8.1% 2020 0.9% 2,299 295 30 7.7% 2021 0.4% 1,166 328 33 3.6% 2022 0.6% 1,486 369 35 4.2% Canadian Malartic 3 2018 2.5% 6,454 20,484 706 0.9% Agnico Eagle Mines Ltd. 2019 1.8% 4,833 21,049 679 0.7% 2020 1.6% 4,373 20,506 569 0.8% 2021 1.5% 4,178 22,260 722 0.6% 2022 1.0% 2,597 19,540 665 0.4% Dolores 2018 2.0% 5,299 6,903 184 2.9% Pan American Silver Corporation 2019 1.9% 5,037 6,777 177 2.8% 2020 1.5% 4,048 6,430 142 2.8% 2021 2.0% 5,658 7,774 186 3.0% 2022 1.9% 5,089 7,957 163 3.1%
 2023 Investment Stewardship Report Page 75 Page 77