
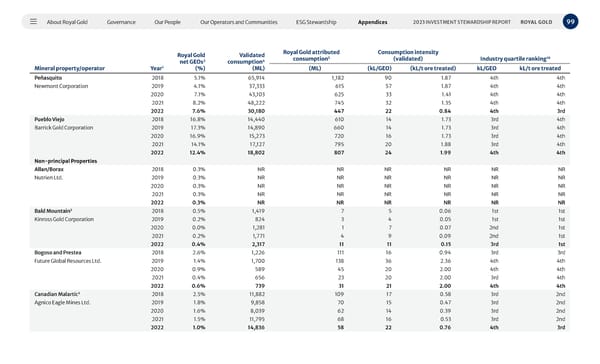
About Royal Gold Governance Our People Our Operators and Communities ESG Stewardship Appendices 99 2023 INVESTMENT STEWARDSHIP REPORT ROYAL GOLD Mineral property/operator Royal Gold net GEOs 2 (%) Validated consumption 4 (ML) Royal Gold attributed consumption 5 Consumption intensity (validated) Industry quartile ranking 10 Year 1 (ML) (kL/GEO) (kL/t ore treated) kL/GEO kL/t ore treated Peñasquito 2018 5.1% 65,914 1,182 90 1.87 4th 4th Newmont Corporation 2019 4.1% 37,333 615 57 1.87 4th 4th 2020 7.1% 43,103 625 33 1.41 4th 4th 2021 8.2% 48,222 745 32 1.35 4th 4th 2022 7.6% 30,180 447 22 0.84 4th 3rd Pueblo Viejo 2018 16.8% 14,440 610 14 1.73 3rd 4th Barrick Gold Corporation 2019 17.3% 14,890 660 14 1.73 3rd 4th 2020 16.9% 15,273 720 16 1.73 3rd 4th 2021 14.1% 17,127 795 20 1.88 3rd 4th 2022 12.4% 18,802 807 24 1.99 4th 4th Non-principal Properties Allan/Borax 2018 0.3% NR NR NR NR NR NR Nutrien Ltd. 2019 0.3% NR NR NR NR NR NR 2020 0.3% NR NR NR NR NR NR 2021 0.3% NR NR NR NR NR NR 2022 0.3% NR NR NR NR NR NR Bald Mountain 3 2018 0.5% 1,419 7 5 0.06 1st 1st Kinross Gold Corporation 2019 0.2% 824 3 4 0.05 1st 1st 2020 0.0% 1,281 1 7 0.07 2nd 1st 2021 0.2% 1,771 4 9 0.09 2nd 1st 2022 0.4% 2,317 11 11 0.15 3rd 1st Bogoso and Prestea 2018 2.6% 1,226 111 16 0.94 3rd 3rd Future Global Resources Ltd. 2019 1.4% 1,700 138 36 2.36 4th 4th 2020 0.9% 589 45 20 2.00 4th 4th 2021 0.4% 656 23 20 2.00 3rd 4th 2022 0.6% 739 31 21 2.00 4th 4th Canadian Malartic 3 2018 2.5% 11,882 109 17 0.58 3rd 2nd Agnico Eagle Mines Ltd. 2019 1.8% 9,858 70 15 0.47 3rd 2nd 2020 1.6% 8,039 62 14 0.39 3rd 2nd 2021 1.5% 11,795 68 16 0.53 3rd 2nd 2022 1.0% 14,836 58 22 0.76 4th 3rd
 2023 Investment Stewardship Report Page 98 Page 100