
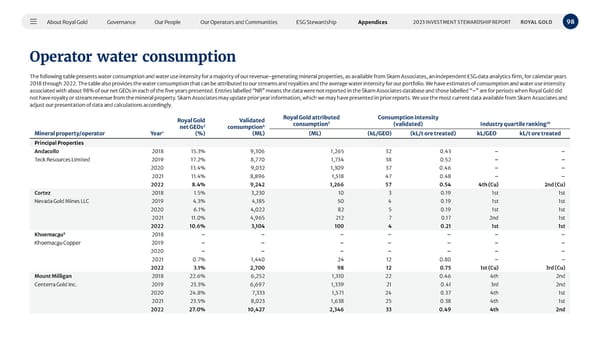
About Royal Gold Governance Our People Our Operators and Communities ESG Stewardship Appendices 98 2023 INVESTMENT STEWARDSHIP REPORT ROYAL GOLD Operator water consumption The following table presents water consumption and water use intensity for a majority of our revenue-generating mineral properties, as available from Skarn Associates, an independent ESG data analytics firm, for calendar years 2018 through 2022. The table also provides the water consumption that can be attributed to our streams and royalties and the average water intensity for our portfolio. We have estimates of consumption and water use intensity associated with about 98% of our net GEOs in each of the five years presented. Entries labelled “NR” means the data were not reported in the Skarn Associates database and those labelled “–” are for periods when Royal Gold did not have royalty or stream revenue from the mineral property. Skarn Associates may update prior year information, which we may have presented in prior reports. We use the most current data available from Skarn Associates and adjust our presentation of data and calculations accordingly. Mineral property/operator Royal Gold net GEOs 2 (%) Validated consumption 4 (ML) Royal Gold attributed consumption 5 Consumption intensity (validated) Industry quartile ranking 10 Year 1 (ML) (kL/GEO) (kL/t ore treated) kL/GEO kL/t ore treated Principal Properties Andacollo 2018 15.3% 9,306 1,265 32 0.43 – – Teck Resources Limited 2019 17.2% 8,770 1,734 38 0.52 – – 2020 13.4% 9,032 1,309 37 0.46 – – 2021 11.4% 8,896 1,518 47 0.48 – – 2022 8.4% 9,242 1,266 57 0.54 4th (Cu) 2nd (Cu) Cortez 2018 1.5% 3,230 10 3 0.19 1st 1st Nevada Gold Mines LLC 2019 4.3% 4,185 50 4 0.19 1st 1st 2020 6.1% 4,022 82 5 0.19 1st 1st 2021 11.0% 4,965 212 7 0.17 2nd 1st 2022 10.6% 3,104 100 4 0.21 1st 1st Khoemac a u 9 2018 – – – – – – – Khoemac a u Copper 2019 – – – – – – – 2020 – – – – – – – 2021 0.7% 1,440 24 12 0.80 – – 2022 3.1% 2,700 98 12 0.75 1st (Cu) 3rd (Cu) Mount Milligan 2018 22.6% 6,252 1,310 22 0.46 4th 2nd Centerra Gold Inc. 2019 23.3% 6,697 1,339 21 0.41 3rd 2nd 2020 24.8% 7,333 1,571 24 0.37 4th 1st 2021 23.5% 8,023 1,638 25 0.38 4th 1st 2022 27.0% 10,427 2,346 33 0.49 4th 2nd
 2023 Investment Stewardship Report Page 97 Page 99