
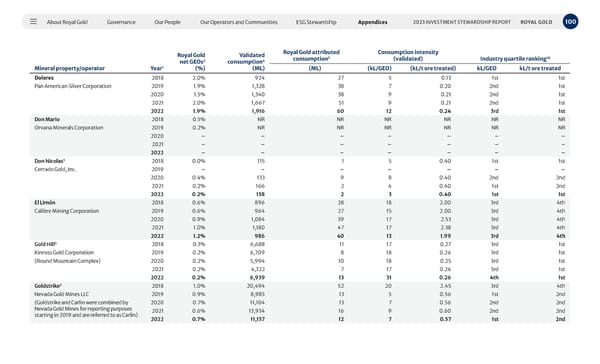
About Royal Gold Governance Our People Our Operators and Communities ESG Stewardship Appendices 100 2023 INVESTMENT STEWARDSHIP REPORT ROYAL GOLD Mineral property/operator Royal Gold net GEOs 2 (%) Validated consumption 4 (ML) Royal Gold attributed consumption 5 Consumption intensity (validated) Industry quartile ranking 10 Year 1 (ML) (kL/GEO) (kL/t ore treated) kL/GEO kL/t ore treated Dolores 2018 2.0% 924 27 5 0.13 1st 1st Pan American Silver Corporation 2019 1.9% 1,328 38 7 0.20 2nd 1st 2020 1.5% 1,340 38 9 0.21 2nd 1st 2021 2.0% 1,667 51 9 0.21 2nd 1st 2022 1.9% 1,916 60 12 0.24 3rd 1st Don Mario 2018 0.5% NR NR NR NR NR NR Orvana Minerals Corporation 2019 0.2% NR NR NR NR NR NR 2020 – – – – – – – 2021 – – – – – – – 2022 – – – – – – – Don Nicolas 3 2018 0.0% 115 1 5 0.40 1st 1st Cerrado Gold, Inc. 2019 – – – – – – – 2020 0.4% 133 9 8 0.40 2nd 2nd 2021 0.2% 166 2 4 0.40 1st 2nd 2022 0.2% 158 2 3 0.40 1st 1st El Limón 2018 0.6% 896 28 18 2.00 3rd 4th Calibre Mining Corporation 2019 0.6% 964 27 15 2.00 3rd 4th 2020 0.9% 1,084 39 17 2.53 3rd 4th 2021 1.0% 1,180 47 17 2.38 3rd 4th 2022 1.2% 986 40 13 1.99 3rd 4th Gold Hill 3 2018 0.3% 6,688 11 17 0.27 3rd 1st Kinross Gold Corporation 2019 0.2% 6,709 8 18 0.26 3rd 1st (Round Mountain Complex) 2020 0.2% 5,994 10 18 0.25 3rd 1st 2021 0.2% 4,322 7 17 0.26 3rd 1st 2022 0.2% 6,939 13 31 0.26 4th 1st Goldstrike 3 2018 1.0% 20,494 52 20 2.45 3rd 4th Nevada Gold Mines LLC 2019 0.9% 8,985 13 5 0.56 1st 2nd (Goldstrike and Carlin were combined by Nevada Gold Mines for reporting purposes starting in 2019 and are referred to as Carlin) 2020 0.7% 11,104 13 7 0.56 2nd 2nd 2021 0.6% 13,934 16 9 0.60 2nd 2nd 2022 0.7% 11,157 12 7 0.57 1st 2nd
 2023 Investment Stewardship Report Page 99 Page 101