
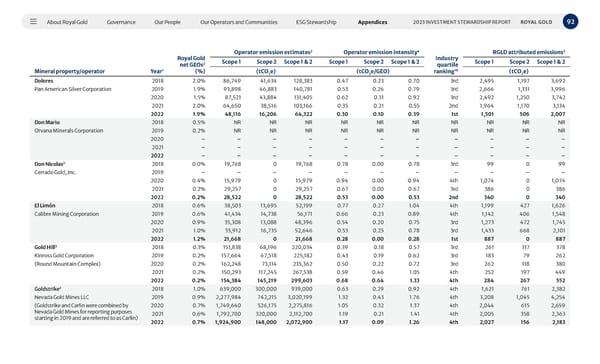
About Royal Gold Governance Our People Our Operators and Communities ESG Stewardship Appendices 92 2023 INVESTMENT STEWARDSHIP REPORT ROYAL GOLD Mineral property/operator Year 1 Royal Gold net GEOs 2 (%) Operator emission estimates 2 Operator emission intensity 4 Industry quartile ranking 10 RGLD attributed emissions 5 Scope 1 Scope 2 Scope 1 & 2 Scope 1 Scope 2 Scope 1 & 2 Scope 1 Scope 2 Scope 1 & 2 (tCO 2 e) (tCO 2 e/GEO) (tCO 2 e) Dolores 2018 2.0% 86,749 41,634 128,383 0.47 0.23 0.70 3rd 2,495 1,197 3,692 Pan American Silver Corporation 2019 1.9% 93,898 46,883 140,781 0.53 0.26 0.79 3rd 2,666 1,331 3,996 2020 1.5% 87,521 43,884 131,405 0.62 0.31 0.92 3rd 2,492 1,250 3,742 2021 2.0% 64,650 38,516 103,166 0.35 0.21 0.55 2nd 1,964 1,170 3,134 2022 1.9% 48,116 16,206 64,322 0.30 0.10 0.39 1st 1,501 506 2,007 Don Mario 2018 0.5% NR NR NR NR NR NR NR NR NR NR Orvana Minerals Corporation 2019 0.2% NR NR NR NR NR NR NR NR NR NR 2020 – – – – – – – – – – – 2021 – – – – – – – – – – – 2022 – – – – – – – – – – – Don Nicolas 3 2018 0.0% 19,768 0 19,768 0.78 0.00 0.78 3rd 99 0 99 Cerrado Gold, Inc. 2019 – – – – – – – – – – – 2020 0.4% 15,979 0 15,979 0.94 0.00 0.94 4th 1,074 0 1,074 2021 0.2% 29,257 0 29,257 0.67 0.00 0.67 3rd 386 0 386 2022 0.2% 28,522 0 28,522 0.53 0.00 0.53 2nd 340 0 340 El Limón 2018 0.6% 38,503 13,695 52,199 0.77 0.27 1.04 4th 1,199 427 1,626 Calibre Mining Corporation 2019 0.6% 41,434 14,738 56,171 0.66 0.23 0.89 4th 1,142 406 1,548 2020 0.9% 35,308 13,088 48,396 0.54 0.20 0.75 3rd 1,273 472 1,745 2021 1.0% 35,912 16,735 52,646 0.53 0.25 0.78 3rd 1,433 668 2,101 2022 1.2% 21,668 0 21,668 0.28 0.00 0.28 1st 887 0 887 Gold Hill 3 2018 0.3% 151,838 68,196 220,034 0.39 0.18 0.57 3rd 261 117 378 Kinross Gold Corporation 2019 0.2% 157,664 67,518 225,182 0.43 0.19 0.62 3rd 183 79 262 (Round Mountain Complex) 2020 0.2% 162,248 73,114 235,362 0.50 0.22 0.72 3rd 262 118 380 2021 0.2% 150,293 117,245 267,538 0.59 0.46 1.05 4th 252 197 449 2022 0.2% 154,384 145,219 299,603 0.68 0.64 1.33 4th 284 267 552 Goldstrike 3 2018 1.0% 639,000 300,000 939,000 0.63 0.29 0.92 4th 1,621 761 2,382 Nevada Gold Mines LLC 2019 0.9% 2,277,984 742,215 3,020,199 1.32 0.43 1.76 4th 3,208 1,045 4,254 (Goldstrike and Carlin were combined by Nevada Gold Mines for reporting purposes starting in 2019 and are referred to as Carlin) 2020 0.7% 1,749,640 526,175 2,275,816 1.05 0.32 1.37 4th 2,044 615 2,659 2021 0.6% 1,792,700 320,000 2,112,700 1.19 0.21 1.41 4th 2,005 358 2,363 2022 0.7% 1,924,900 148,000 2,072,900 1.17 0.09 1.26 4th 2,027 156 2,183
 2023 Investment Stewardship Report Page 91 Page 93