
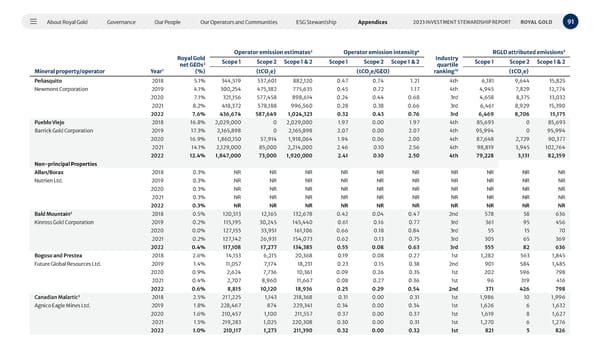
About Royal Gold Governance Our People Our Operators and Communities ESG Stewardship Appendices 91 2023 INVESTMENT STEWARDSHIP REPORT ROYAL GOLD Mineral property/operator Year 1 Royal Gold net GEOs 2 (%) Operator emission estimates 2 Operator emission intensity 4 Industry quartile ranking 10 RGLD attributed emissions 5 Scope 1 Scope 2 Scope 1 & 2 Scope 1 Scope 2 Scope 1 & 2 Scope 1 Scope 2 Scope 1 & 2 (tCO 2 e) (tCO 2 e/GEO) (tCO 2 e) Peñasquito 2018 5.1% 344,519 537,601 882,120 0.47 0.74 1.21 4th 6,181 9,644 15,825 Newmont Corporation 2019 4.1% 300,254 475,382 775,635 0.45 0.72 1.17 4th 4,945 7,829 12,774 2020 7.1% 321,156 577,458 898,614 0.24 0.44 0.68 3rd 4,658 8,375 13,032 2021 8.2% 418,372 578,188 996,560 0.28 0.38 0.66 3rd 6,461 8,929 15,390 2022 7.6% 436,674 587,649 1,024,323 0.32 0.43 0.76 3rd 6,469 8,706 15,175 Pueblo Viejo 2018 16.8% 2,029,000 0 2,029,000 1.97 0.00 1.97 4th 85,693 0 85,693 Barrick Gold Corporation 2019 17.3% 2,165,898 0 2,165,898 2.07 0.00 2.07 4th 95,994 0 95,994 2020 16.9% 1,860,150 57,914 1,918,064 1.94 0.06 2.00 4th 87,648 2,729 90,377 2021 14.1% 2,129,000 85,000 2,214,000 2.46 0.10 2.56 4th 98,819 3,945 102,764 2022 12.4% 1,847,000 73,000 1,920,000 2.41 0.10 2.50 4th 79,228 3,131 82,359 Non-principal Properties Allan/Borax 2018 0.3% NR NR NR NR NR NR NR NR NR NR Nutrien Ltd. 2019 0.3% NR NR NR NR NR NR NR NR NR NR 2020 0.3% NR NR NR NR NR NR NR NR NR NR 2021 0.3% NR NR NR NR NR NR NR NR NR NR 2022 0.3% NR NR NR NR NR NR NR NR NR NR Bald Mountain 3 2018 0.5% 120,513 12,165 132,678 0.42 0.04 0.47 2nd 578 58 636 Kinross Gold Corporation 2019 0.2% 115,195 30,245 145,440 0.61 0.16 0.77 3rd 361 95 456 2020 0.0% 127,155 33,951 161,106 0.66 0.18 0.84 3rd 55 15 70 2021 0.2% 127,142 26,931 154,073 0.62 0.13 0.75 3rd 305 65 369 2022 0.4% 117,108 17,277 134,385 0.55 0.08 0.63 3rd 555 82 636 Bogoso and Prestea 2018 2.6% 14,153 6,215 20,368 0.19 0.08 0.27 1st 1,282 563 1,845 Future Global Resources Ltd. 2019 1.4% 11,057 7,174 18,231 0.23 0.15 0.38 2nd 901 584 1,485 2020 0.9% 2,624 7,736 10,361 0.09 0.26 0.35 1st 202 596 798 2021 0.4% 2,707 8,960 11,667 0.08 0.27 0.36 1st 96 319 416 2022 0.6% 8,815 10,120 18,936 0.25 0.29 0.54 2nd 371 426 798 Canadian Malartic 3 2018 2.5% 217,225 1,143 218,368 0.31 0.00 0.31 1st 1,986 10 1,996 Agnico Eagle Mines Ltd. 2019 1.8% 228,467 874 229,341 0.34 0.00 0.34 1st 1,626 6 1,632 2020 1.6% 210,457 1,100 211,557 0.37 0.00 0.37 1st 1,619 8 1,627 2021 1.5% 219,283 1,025 220,308 0.30 0.00 0.31 1st 1,270 6 1,276 2022 1.0% 210,117 1,273 211,390 0.32 0.00 0.32 1st 821 5 826
 2023 Investment Stewardship Report Page 90 Page 92