
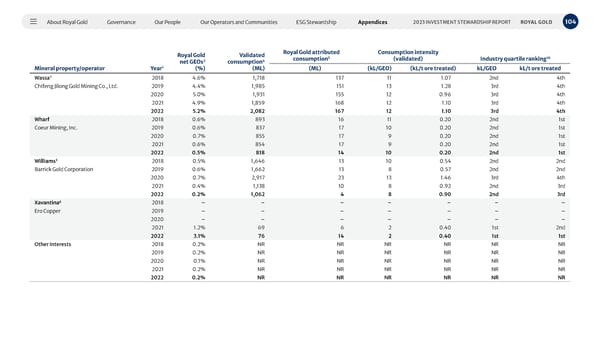
About Royal Gold Governance Our People Our Operators and Communities ESG Stewardship Appendices 104 2023 INVESTMENT STEWARDSHIP REPORT ROYAL GOLD Mineral property/operator Royal Gold net GEOs 2 (%) Validated consumption 4 (ML) Royal Gold attributed consumption 5 Consumption intensity (validated) Industry quartile ranking 10 Year 1 (ML) (kL/GEO) (kL/t ore treated) kL/GEO kL/t ore treated Wassa 7 2018 4.6% 1,718 137 11 1.07 2nd 4th Chifeng Jilong Gold Mining Co., Ltd. 2019 4.4% 1,985 151 13 1.28 3rd 4th 2020 5.0% 1,931 155 12 0.96 3rd 4th 2021 4.9% 1,859 168 12 1.10 3rd 4th 2022 5.2% 2,082 167 12 1.10 3rd 4th Wharf 2018 0.6% 893 16 11 0.20 2nd 1st Coeur Mining, Inc. 2019 0.6% 837 17 10 0.20 2nd 1st 2020 0.7% 855 17 9 0.20 2nd 1st 2021 0.6% 854 17 9 0.20 2nd 1st 2022 0.5% 818 14 10 0.20 2nd 1st Williams 3 2018 0.5% 1,646 13 10 0.54 2nd 2nd Barrick Gold Corporation 2019 0.6% 1,662 13 8 0.57 2nd 2nd 2020 0.7% 2,917 23 13 1.46 3rd 4th 2021 0.4% 1,138 10 8 0.92 2nd 3rd 2022 0.2% 1,062 4 8 0.90 2nd 3rd Xavantina 8 2018 – – – – – – – Ero Copper 2019 – – – – – – – 2020 – – – – – – – 2021 1.2% 69 6 2 0.40 1st 2nd 2022 3.1% 76 14 2 0.40 1st 1st Other Interests 2018 0.2% NR NR NR NR NR NR 2019 0.2% NR NR NR NR NR NR 2020 0.1% NR NR NR NR NR NR 2021 0.2% NR NR NR NR NR NR 2022 0.2% NR NR NR NR NR NR
 2023 Investment Stewardship Report Page 103 Page 105