
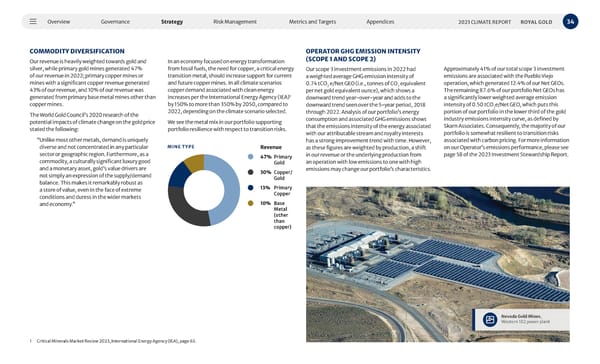
Overview Governance Strategy Risk Management Metrics and Targets Appendices 34 2023 CLIMATE REPORT ROYAL GOLD COMMODITY DIVERSIFICATION 1 Critical Minerals Market Review 2023, International Energy Agency (IEA), page 63. Our revenue is heavily weighted towards gold and silver, while primary gold mines generated 47% of our revenue in 2022; primary copper mines or mines with a significant copper revenue generated 43% of our revenue, and 10% of our revenue was generated from primary base metal mines other than copper mines. The World Gold Council’s 2020 research of the potential impacts of climate change on the gold price stated the following: “ Unlike most other metals, demand is uniquely diverse and not concentrated in any particular sector or geographic region. Furthermore, as a commodity, a culturally significant luxury good and a monetary asset, gold’s value drivers are not simply an expression of the supply/demand balance. This makes it remarkably robust as a store of value, even in the face of extreme conditions and duress in the wider markets and economy.” In an economy focused on energy transformation from fossil fuels, the need for copper, a critical energy transition metal, should increase support for current and future copper mines. In all climate scenarios copper demand associated with clean energy increases per the International Energy Agency (IEA) 1 by 150% to more than 350% by 2050, compared to 2022, depending on the climate scenario selected. We see the metal mix in our portfolio supporting portfolio resilience with respect to transition risks. MINE TYPE OPERATOR GHG EMISSION INTENSITY (SCOPE 1 AND SCOPE 2) Our scope 3 investment emissions in 2022 had a weighted average GHG emission intensity of 0.74 tCO 2 e/Net GEO (i.e., tonnes of CO 2 equivalent per net gold equivalent ounce), which shows a downward trend year-over-year and adds to the downward trend seen over the 5-year period, 2018 through 2022. Analysis of our portfolio’s energy consumption and associated GHG emissions shows that the emissions intensity of the energy associated with our attributable stream and royalty interests has a strong improvement trend with time. However, as these figures are weighted by production, a shift in our revenue or the underlying production from an operation with low emissions to one with high emissions may change our portfolio’s characteristics. Revenue 47% Primary Gold 30% Copper/ Gold 13% Primary Copper 10% Base Metal (other than copper) Approximately 41% of our total scope 3 investment emissions are associated with the Pueblo Viejo operation, which generated 12.4% of our Net GEOs. The remaining 87.6% of our portfolio Net GEOs has a significantly lower weighted average emission intensity of 0.50 tCO 2 e/Net GEO, which puts this portion of our portfolio in the lower third of the gold industry emissions intensity curve, as defined by Skarn Associates. Consequently, the majority of our portfolio is somewhat resilient to transition risks associated with carbon pricing. For more information on our Operator’s emissions performance, please see page 58 of the 2023 Investment Stewardship Report. Nevada Gold Mines , Western 102 power plant
 2023 Climate Report Page 33 Page 35