
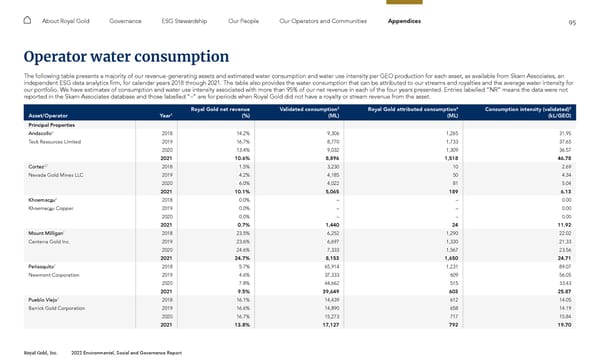
95 Royal Gold, Inc. 2022 Environmental, Social and Governance Report About Royal Gold Governance ESG Stewardship Our People Our Operators and Communities Appendices Operator water consumption The following table presents a majority of our revenue-generating assets and estimated water consumption and water use intensity per GEO production for each asset, as available from Skarn Associates, an independent ESG data analytics firm, for calendar years 2018 through 2021. The table also provides the water consumption that can be attributed to our streams and royalties and the average water intensity for our portfolio. We have estimates of consumption and water use intensity associated with more than 95% of our net revenue in each of the four years presented. Entries labelled “NR” means the data were not reported in the Skarn Associates database and those labelled “–” are for periods when Royal Gold did not have a royalty or stream revenue from the asset. Asset/Operator Year 1 Royal Gold net revenue (%) Validated consumption 2 (ML) Royal Gold attributed consumption 4 (ML) Consumption intensity (validated) 2 (kL/GEO) Principal Properties Andacollo 8 2018 14.2% 9,306 1,265 31.95 Teck Resources Limited 2019 16.7% 8,770 1,733 37.65 2020 13.4% 9,032 1,309 36.57 2021 10.6% 8,896 1,518 46.78 Cortez 3,7 2018 1.5% 3,230 10 2.69 Nevada Gold Mines LLC 2019 4.2% 4,185 50 4.34 2020 6.0% 4,022 81 5.04 2021 10.1% 5,065 189 6.13 Khoemac a u 8 2018 0.0% – – 0.00 Khoemac a u Copper 2019 0.0% – – 0.00 2020 0.0% – – 0.00 2021 0.7% 1,440 24 11.92 Mount Milligan 7 2018 23.5% 6,252 1,290 22.02 Centerra Gold Inc. 2019 23.6% 6,697 1,330 21.33 2020 24.6% 7,333 1,567 23.56 2021 24.7% 8,153 1,650 24.71 Peñasquito 7 2018 5.7% 65,914 1,231 89.07 Newmont Corporation 2019 4.6% 37,333 609 56.05 2020 7.8% 44,662 515 33.43 2021 9.5% 39,649 603 25.87 Pueblo Viejo 7 2018 16.1% 14,439 612 14.05 Barrick Gold Corporation 2019 16.6% 14,890 658 14.19 2020 16.7% 15,273 717 15.84 2021 13.8% 17,127 792 19.70
 2022 ESG Report Page 94 Page 96