
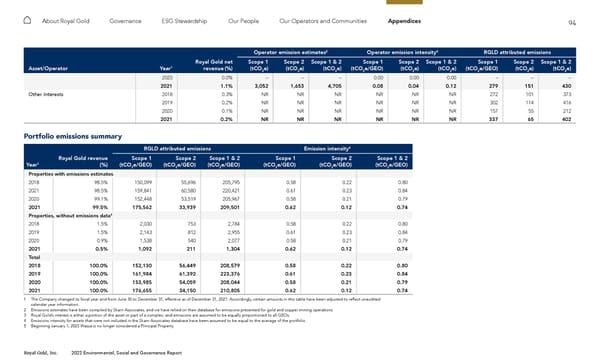
94 Royal Gold, Inc. 2022 Environmental, Social and Governance Report About Royal Gold Governance ESG Stewardship Our People Our Operators and Communities Appendices Operator emission estimates 2 Operator emission intensity 4 RGLD attributed emissions Asset/Operator Year 1 Royal Gold net revenue (%) Scope 1 (tCO 2 e) Scope 2 (tCO 2 e) Scope 1 & 2 (tCO 2 e) Scope 1 (tCO 2 e/GEO) Scope 2 (tCO 2 e) Scope 1 & 2 (tCO 2 e) Scope 1 (tCO 2 e/GEO) Scope 2 (tCO 2 e) Scope 1 & 2 (tCO 2 e) 2020 0.0% – – – 0.00 0.00 0.00 – – – 2021 1.1% 3,052 1,653 4,705 0.08 0.04 0.12 279 151 430 Other Interests 2018 0.3% NR NR NR NR NR NR 272 101 373 2019 0.2% NR NR NR NR NR NR 302 114 416 2020 0.1% NR NR NR NR NR NR 157 55 212 2021 0.2% NR NR NR NR NR NR 337 65 402 Portfolio emissions summary RGLD attributed emissions Emission intensity 4 Year 1 Royal Gold revenue (%) Scope 1 (tCO 2 e/GEO) Scope 2 (tCO 2 e/GEO) Scope 1 & 2 (tCO 2 e/GEO) Scope 1 (tCO 2 e/GEO) Scope 2 (tCO 2 e/GEO) Scope 1 & 2 (tCO 2 e/GEO) Properties with emissions estimates 2018 98.5% 150,099 55,696 205,795 0.58 0.22 0.80 2021 98.5% 159,841 60,580 220,421 0.61 0.23 0.84 2020 99.1% 152,448 53,519 205,967 0.58 0.21 0.79 2021 99.5% 175,562 33,939 209,501 0.62 0.12 0.74 Properties, without emissions data 4 2018 1.5% 2,030 753 2,784 0.58 0.22 0.80 2019 1.5% 2,143 812 2,955 0.61 0.23 0.84 2020 0.9% 1,538 540 2,077 0.58 0.21 0.79 2021 0.5% 1,092 211 1,304 0.62 0.12 0.74 Total 2018 100.0% 152,130 56,449 208,579 0.58 0.22 0.80 2019 100.0% 161,984 61,392 223,376 0.61 0.23 0.84 2020 100.0% 153,985 54,059 208,044 0.58 0.21 0.79 2021 100.0% 176,655 34,150 210,805 0.62 0.12 0.74 1 The Company changed its fiscal year end from June 30 to December 31, effective as of December 31, 2021. Accordingly, certain amounts in this table have been adjusted to reflect unaudited calendar year information. 2 Emissions estimates have been compiled by Skarn Associates, and we have relied on their database for emissions presented for gold and copper mining operations. 3 Royal Gold’s interest is either a portion of the asset or part of a complex, and emissions are assumed to be equally proportioned to all GEOs. 4 Emissions intensity for assets that were not included in the Skarn Associates database have been assumed to be equal to the average of the portfolio. 5 Beginning January 1, 2023 Wassa is no longer considered a Principal Property.
 2022 ESG Report Page 93 Page 95