
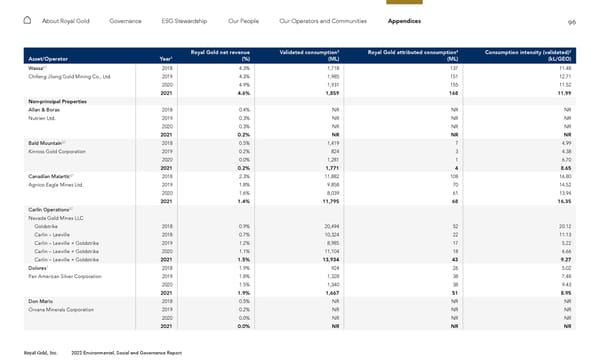
96 Royal Gold, Inc. 2022 Environmental, Social and Governance Report About Royal Gold Governance ESG Stewardship Our People Our Operators and Communities Appendices Asset/Operator Year 1 Royal Gold net revenue (%) Validated consumption 2 (ML) Royal Gold attributed consumption 4 (ML) Consumption intensity (validated) 2 (kL/GEO) Wassa 6,7 2018 4.3% 1,718 137 11.48 Chifeng Jilong Gold Mining Co., Ltd. 2019 4.3% 1,985 151 12.71 2020 4.9% 1,931 155 11.52 2021 4.6% 1,859 168 11.99 Non-principal Properties Allan & Borax 2018 0.4% NR NR NR Nutrien Ltd. 2019 0.3% NR NR NR 2020 0.3% NR NR NR 2021 0.2% NR NR NR Bald Mountain 3,7 2018 0.5% 1,419 7 4.99 Kinross Gold Corporation 2019 0.2% 824 3 4.38 2020 0.0% 1,281 1 6.70 2021 0.2% 1,771 4 8.65 Canadian Malartic 3,7 2018 2.3% 11,882 108 16.80 Agnico Eagle Mines Ltd. 2019 1.8% 9,858 70 14.52 2020 1.6% 8,039 61 13.94 2021 1.4% 11,795 68 16.35 Carlin Operations 3,7 Nevada Gold Mines LLC Goldstrike 2018 0.9% 20,494 52 20.12 Carlin – Leeville 2018 0.7% 10,324 22 11.13 Carlin – Leeville + Goldstrike 2019 1.2% 8,985 17 5.22 Carlin – Leeville + Goldstrike 2020 1.1% 11,104 18 6.66 Carlin – Leeville + Goldstrike 2021 1.5% 13,934 43 9.27 Dolores 7 2018 1.9% 924 26 5.02 Pan American Silver Corporation 2019 1.8% 1,328 38 7.48 2020 1.5% 1,340 38 9.43 2021 1.9% 1,667 51 8.95 Don Mario 2018 0.5% NR NR NR Orvana Minerals Corporation 2019 0.2% NR NR NR 2020 0.0% NR NR NR 2021 0.0% NR NR NR
 2022 ESG Report Page 95 Page 97