
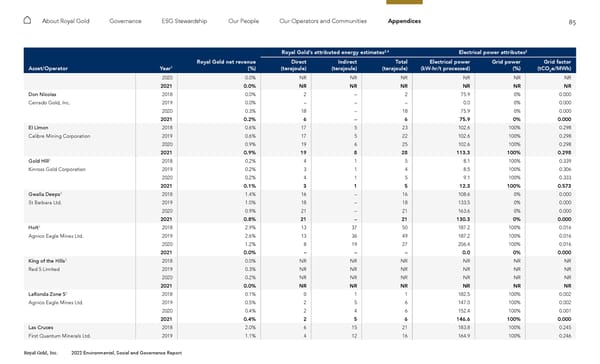
85 Royal Gold, Inc. 2022 Environmental, Social and Governance Report About Royal Gold Governance ESG Stewardship Our People Our Operators and Communities Appendices Royal Gold’s attributed energy estimates 2,4 Electrical power attributes 2 Asset/Operator Year 1 Royal Gold net revenue (%) Direct (terajoule) Indirect (terajoule) Total (terajoule) Electrical power (kW-hr/t processed) Grid power (%) Grid factor (tCO 2 e/MWh) 2020 0.0% NR NR NR NR NR NR 2021 0.0% NR NR NR NR NR NR Don Nicolas 2018 0.0% 2 – 2 75.9 0% 0.000 Cerrado Gold, Inc. 2019 0.0% – – – 0.0 0% 0.000 2020 0.3% 18 – 18 75.9 0% 0.000 2021 0.2% 6 – 6 75.9 0% 0.000 El Limon 2018 0.6% 17 5 23 102.6 100% 0.298 Calibre Mining Corporation 2019 0.6% 17 5 22 102.6 100% 0.298 2020 0.9% 19 6 25 102.6 100% 0.298 2021 0.9% 19 8 28 113.3 100% 0.298 Gold Hill 3 2018 0.2% 4 1 5 8.1 100% 0.339 Kinross Gold Corporation 2019 0.2% 3 1 4 8.5 100% 0.306 2020 0.2% 4 1 5 9.1 100% 0.333 2021 0.1% 3 1 5 12.3 100% 0.573 Gwalia Deeps 3 2018 1.4% 16 – 16 108.6 0% 0.000 St Barbara Ltd. 2019 1.0% 18 – 18 133.5 0% 0.000 2020 0.9% 21 – 21 163.6 0% 0.000 2021 0.8% 21 – 21 130.3 0% 0.000 Holt 3 2018 2.9% 13 37 50 187.2 100% 0.016 Agnico Eagle Mines Ltd. 2019 2.6% 13 36 49 187.2 100% 0.016 2020 1.2% 8 19 27 206.4 100% 0.016 2021 0.0% – – – 0.0 0% 0.000 King of the Hills 3 2018 0.0% NR NR NR NR NR NR Red 5 Limited 2019 0.3% NR NR NR NR NR NR 2020 0.2% NR NR NR NR NR NR 2021 0.0% NR NR NR NR NR NR LaRonda Zone 5 3 2018 0.1% 0 1 1 182.5 100% 0.002 Agnico Eagle Mines Ltd. 2019 0.5% 2 5 6 147.0 100% 0.002 2020 0.4% 2 4 6 152.4 100% 0.001 2021 0.4% 2 5 6 146.6 100% 0.000 Las Cruces 2018 2.0% 6 15 21 183.8 100% 0.245 First Quantum Minerals Ltd. 2019 1.1% 4 12 16 164.9 100% 0.246
 2022 ESG Report Page 84 Page 86