
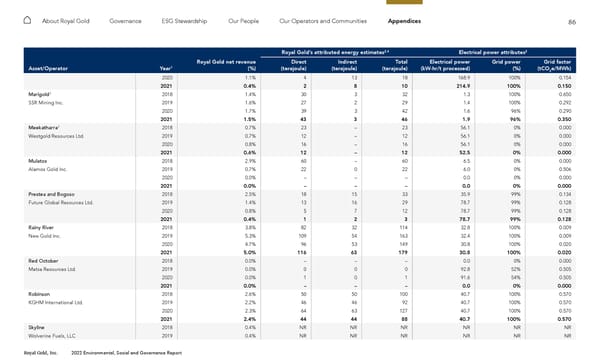
86 Royal Gold, Inc. 2022 Environmental, Social and Governance Report About Royal Gold Governance ESG Stewardship Our People Our Operators and Communities Appendices Royal Gold’s attributed energy estimates 2,4 Electrical power attributes 2 Asset/Operator Year 1 Royal Gold net revenue (%) Direct (terajoule) Indirect (terajoule) Total (terajoule) Electrical power (kW-hr/t processed) Grid power (%) Grid factor (tCO 2 e/MWh) 2020 1.1% 4 13 18 168.9 100% 0.154 2021 0.4% 2 8 10 214.9 100% 0.150 Marigold 3 2018 1.4% 30 3 32 1.3 100% 0.650 SSR Mining Inc. 2019 1.6% 27 2 29 1.4 100% 0.292 2020 1.7% 39 3 42 1.6 96% 0.290 2021 1.5% 43 3 46 1.9 96% 0.350 Meekatharra 3 2018 0.7% 23 – 23 56.1 0% 0.000 Westgold Resources Ltd. 2019 0.7% 12 – 12 56.1 0% 0.000 2020 0.8% 16 – 16 56.1 0% 0.000 2021 0.6% 12 – 12 52.5 0% 0.000 Mulatos 2018 2.9% 60 – 60 6.5 0% 0.000 Alamos Gold Inc. 2019 0.7% 22 0 22 6.0 0% 0.506 2020 0.0% – – – 0.0 0% 0.000 2021 0.0% – – – 0.0 0% 0.000 Prestea and Bogoso 2018 2.5% 18 15 33 35.9 99% 0.134 Future Global Resources Ltd. 2019 1.4% 13 16 29 78.7 99% 0.128 2020 0.8% 5 7 12 78.7 99% 0.128 2021 0.4% 1 2 3 78.7 99% 0.128 Rainy River 2018 3.8% 82 32 114 32.8 100% 0.009 New Gold Inc. 2019 5.3% 109 54 163 32.4 100% 0.009 2020 4.7% 96 53 149 30.8 100% 0.020 2021 5.0% 116 63 179 30.8 100% 0.020 Red October 2018 0.0% – – – 0.0 0% 0.000 Matsa Resources Ltd. 2019 0.0% 0 0 0 92.8 52% 0.505 2020 0.0% 1 0 1 91.6 54% 0.505 2021 0.0% – – – 0.0 0% 0.000 Robinson 2018 2.6% 50 50 100 40.7 100% 0.570 KGHM International Ltd. 2019 2.2% 46 46 92 40.7 100% 0.570 2020 2.3% 64 63 127 40.7 100% 0.570 2021 2.4% 44 44 88 40.7 100% 0.570 Skyline 2018 0.4% NR NR NR NR NR NR Wolverine Fuels, LLC 2019 0.4% NR NR NR NR NR NR
 2022 ESG Report Page 85 Page 87