
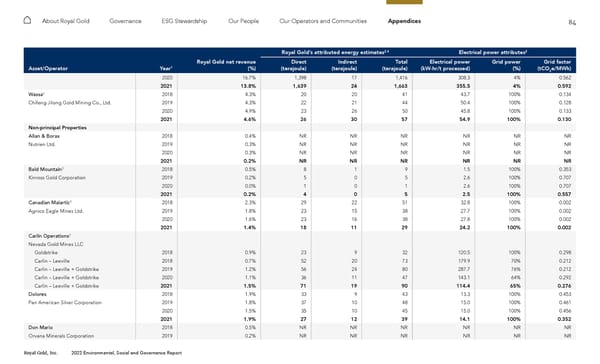
84 Royal Gold, Inc. 2022 Environmental, Social and Governance Report About Royal Gold Governance ESG Stewardship Our People Our Operators and Communities Appendices Royal Gold’s attributed energy estimates 2,4 Electrical power attributes 2 Asset/Operator Year 1 Royal Gold net revenue (%) Direct (terajoule) Indirect (terajoule) Total (terajoule) Electrical power (kW-hr/t processed) Grid power (%) Grid factor (tCO 2 e/MWh) 2020 16.7% 1,398 17 1,416 308.3 4% 0.562 2021 13.8% 1,639 24 1,663 355.5 4% 0.592 Wassa 6 2018 4.3% 20 20 41 43.7 100% 0.134 Chifeng Jilong Gold Mining Co., Ltd. 2019 4.3% 22 21 44 50.4 100% 0.128 2020 4.9% 23 26 50 45.8 100% 0.133 2021 4.6% 26 30 57 54.9 100% 0.130 Non-principal Properties Allan & Borax 2018 0.4% NR NR NR NR NR NR Nutrien Ltd. 2019 0.3% NR NR NR NR NR NR 2020 0.3% NR NR NR NR NR NR 2021 0.2% NR NR NR NR NR NR Bald Mountain 3 2018 0.5% 8 1 9 1.5 100% 0.353 Kinross Gold Corporation 2019 0.2% 5 0 5 2.6 100% 0.707 2020 0.0% 1 0 1 2.6 100% 0.707 2021 0.2% 4 0 5 2.5 100% 0.557 Canadian Malartic 3 2018 2.3% 29 22 51 32.8 100% 0.002 Agnico Eagle Mines Ltd. 2019 1.8% 23 15 38 27.7 100% 0.002 2020 1.6% 23 16 38 27.8 100% 0.002 2021 1.4% 18 11 29 24.2 100% 0.002 Carlin Operations 3 Nevada Gold Mines LLC Goldstrike 2018 0.9% 23 9 32 120.5 100% 0.298 Carlin – Leeville 2018 0.7% 52 20 73 179.9 70% 0.212 Carlin – Leeville + Goldstrike 2019 1.2% 56 24 80 287.7 76% 0.212 Carlin – Leeville + Goldstrike 2020 1.1% 36 11 47 143.1 64% 0.292 Carlin – Leeville + Goldstrike 2021 1.5% 71 19 90 114.4 65% 0.276 Dolores 2018 1.9% 33 9 43 13.3 100% 0.453 Pan American Silver Corporation 2019 1.8% 37 10 48 15.0 100% 0.461 2020 1.5% 35 10 45 15.0 100% 0.456 2021 1.9% 27 12 39 14.1 100% 0.352 Don Mario 2018 0.5% NR NR NR NR NR NR Orvana Minerals Corporation 2019 0.2% NR NR NR NR NR NR
 2022 ESG Report Page 83 Page 85