
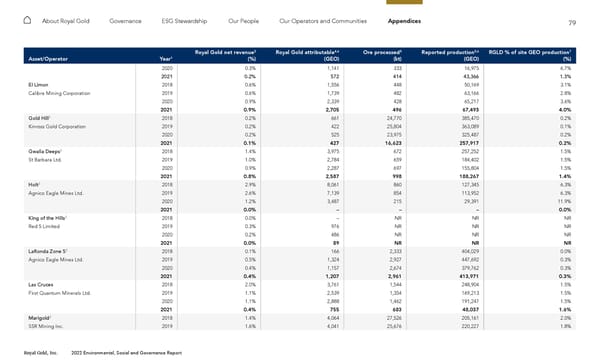
79 Royal Gold, Inc. 2022 Environmental, Social and Governance Report About Royal Gold Governance ESG Stewardship Our People Our Operators and Communities Appendices Asset/Operator Year 1 Royal Gold net revenue 2 (%) Royal Gold attributable 4,6 (GEO) Ore processed 5 (kt) Reported production 5,6 (GEO) RGLD % of site GEO production 7 (%) 2020 0.3% 1,141 333 16,975 6.7% 2021 0.2% 572 414 43,366 1.3% El Limon 2018 0.6% 1,556 448 50,169 3.1% Calibre Mining Corporation 2019 0.6% 1,739 482 63,166 2.8% 2020 0.9% 2,339 428 65,217 3.6% 2021 0.9% 2,705 496 67,493 4.0% Gold Hill 3 2018 0.2% 661 24,770 385,470 0.2% Kinross Gold Corporation 2019 0.2% 422 25,804 363,089 0.1% 2020 0.2% 525 23,975 325,487 0.2% 2021 0.1% 427 16,623 257,917 0.2% Gwalia Deeps 3 2018 1.4% 3,975 672 257,252 1.5% St Barbara Ltd. 2019 1.0% 2,784 659 184,402 1.5% 2020 0.9% 2,287 697 155,804 1.5% 2021 0.8% 2,587 998 188,267 1.4% Holt 3 2018 2.9% 8,061 860 127,345 6.3% Agnico Eagle Mines Ltd. 2019 2.6% 7,139 854 113,952 6.3% 2020 1.2% 3,487 215 29,391 11.9% 2021 0.0% – – – 0.0% King of the Hills 3 2018 0.0% – NR NR NR Red 5 Limited 2019 0.3% 976 NR NR NR 2020 0.2% 486 NR NR NR 2021 0.0% 89 NR NR NR LaRonda Zone 5 3 2018 0.1% 166 2,333 404,029 0.0% Agnico Eagle Mines Ltd. 2019 0.5% 1,324 2,927 447,692 0.3% 2020 0.4% 1,157 2,674 379,762 0.3% 2021 0.4% 1,207 2,961 413,971 0.3% Las Cruces 2018 2.0% 3,761 1,544 248,904 1.5% First Quantum Minerals Ltd. 2019 1.1% 2,539 1,354 169,213 1.5% 2020 1.1% 2,888 1,462 191,247 1.5% 2021 0.4% 755 683 48,037 1.6% Marigold 3 2018 1.4% 4,064 27,526 205,161 2.0% SSR Mining Inc. 2019 1.6% 4,041 25,676 220,227 1.8%
 2022 ESG Report Page 78 Page 80