
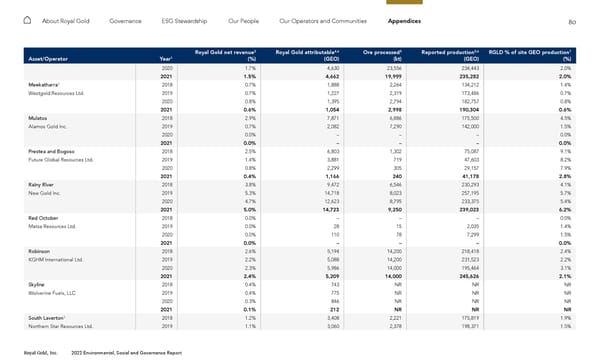
80 Royal Gold, Inc. 2022 Environmental, Social and Governance Report About Royal Gold Governance ESG Stewardship Our People Our Operators and Communities Appendices Asset/Operator Year 1 Royal Gold net revenue 2 (%) Royal Gold attributable 4,6 (GEO) Ore processed 5 (kt) Reported production 5,6 (GEO) RGLD % of site GEO production 7 (%) 2020 1.7% 4,630 23,556 234,443 2.0% 2021 1.5% 4,662 19,999 235,282 2.0% Meekatharra 3 2018 0.7% 1,888 2,264 134,212 1.4% Westgold Resources Ltd. 2019 0.7% 1,227 2,319 173,486 0.7% 2020 0.8% 1,395 2,794 182,757 0.8% 2021 0.6% 1,054 2,998 190,304 0.6% Mulatos 2018 2.9% 7,871 6,886 175,500 4.5% Alamos Gold Inc. 2019 0.7% 2,082 7,290 142,000 1.5% 2020 0.0% – – – 0.0% 2021 0.0% – – – 0.0% Prestea and Bogoso 2018 2.5% 6,803 1,302 75,087 9.1% Future Global Resources Ltd. 2019 1.4% 3,881 719 47,603 8.2% 2020 0.8% 2,299 305 29,157 7.9% 2021 0.4% 1,166 240 41,178 2.8% Rainy River 2018 3.8% 9,472 6,546 230,293 4.1% New Gold Inc. 2019 5.3% 14,718 8,023 257,195 5.7% 2020 4.7% 12,623 8,795 233,375 5.4% 2021 5.0% 14,723 9,250 239,023 6.2% Red October 2018 0.0% – – – 0.0% Matsa Resources Ltd. 2019 0.0% 28 15 2,035 1.4% 2020 0.0% 110 78 7,299 1.5% 2021 0.0% – – – 0.0% Robinson 2018 2.6% 5,194 14,200 218,418 2.4% KGHM International Ltd. 2019 2.2% 5,088 14,200 231,523 2.2% 2020 2.3% 5,986 14,000 195,464 3.1% 2021 2.4% 5,209 14,000 245,626 2.1% Skyline 2018 0.4% 743 NR NR NR Wolverine Fuels, LLC 2019 0.4% 775 NR NR NR 2020 0.3% 846 NR NR NR 2021 0.1% 212 NR NR NR South Laverton 3 2018 1.2% 3,408 2,221 175,819 1.9% Northern Star Resources Ltd. 2019 1.1% 3,060 2,378 198,371 1.5%
 2022 ESG Report Page 79 Page 81