
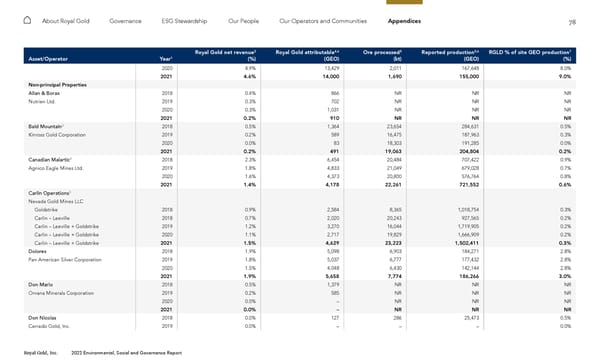
78 Royal Gold, Inc. 2022 Environmental, Social and Governance Report About Royal Gold Governance ESG Stewardship Our People Our Operators and Communities Appendices Asset/Operator Year 1 Royal Gold net revenue 2 (%) Royal Gold attributable 4,6 (GEO) Ore processed 5 (kt) Reported production 5,6 (GEO) RGLD % of site GEO production 7 (%) 2020 4.9% 13,429 2,011 167,648 8.0% 2021 4.6% 14,000 1,690 155,000 9.0% Non-principal Properties Allan & Borax 2018 0.4% 866 NR NR NR Nutrien Ltd. 2019 0.3% 702 NR NR NR 2020 0.3% 1,031 NR NR NR 2021 0.2% 910 NR NR NR Bald Mountain 3 2018 0.5% 1,364 23,654 284,631 0.5% Kinross Gold Corporation 2019 0.2% 589 16,475 187,963 0.3% 2020 0.0% 83 18,303 191,285 0.0% 2021 0.2% 491 19,063 204,804 0.2% Canadian Malartic 3 2018 2.3% 6,454 20,484 707,422 0.9% Agnico Eagle Mines Ltd. 2019 1.8% 4,833 21,049 679,028 0.7% 2020 1.6% 4,373 20,800 576,764 0.8% 2021 1.4% 4,178 22,261 721,552 0.6% Carlin Operations 3 Nevada Gold Mines LLC Goldstrike 2018 0.9% 2,584 8,365 1,018,754 0.3% Carlin – Leeville 2018 0.7% 2,020 20,243 927,565 0.2% Carlin – Leeville + Goldstrike 2019 1.2% 3,270 16,044 1,719,905 0.2% Carlin – Leeville + Goldstrike 2020 1.1% 2,717 19,829 1,666,909 0.2% Carlin – Leeville + Goldstrike 2021 1.5% 4,629 23,223 1,502,411 0.3% Dolores 2018 1.9% 5,098 6,903 184,271 2.8% Pan American Silver Corporation 2019 1.8% 5,037 6,777 177,432 2.8% 2020 1.5% 4,048 6,430 142,144 2.8% 2021 1.9% 5,658 7,774 186,266 3.0% Don Mario 2018 0.5% 1,379 NR NR NR Orvana Minerals Corporation 2019 0.2% 585 NR NR NR 2020 0.0% – NR NR NR 2021 0.0% – NR NR NR Don Nicolas 2018 0.0% 127 286 25,473 0.5% Cerrado Gold, Inc. 2019 0.0% – – – 0.0%
 2022 ESG Report Page 77 Page 79