
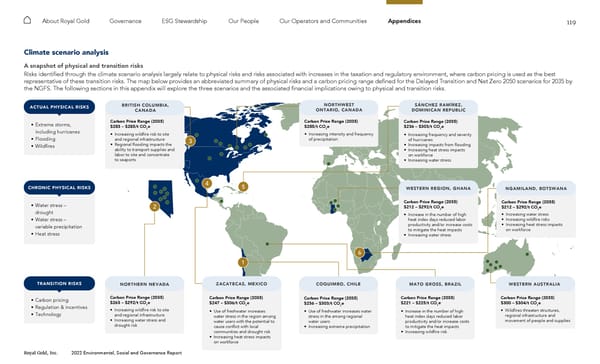
119 Royal Gold, Inc. 2022 Environmental, Social and Governance Report About Royal Gold Governance ESG Stewardship Our People Our Operators and Communities Appendices Climate scenario analysis A snapshot of physical and transition risks Risks identified through the climate scenario analysis largely relate to physical risks and risks associated with increases in the taxation and regulatory environment, where carbon pricing is used as the best representative of these transition risks. The map below provides an abbreviated summary of physical risks and a carbon pricing range defined for the Delayed Transition and Net Zero 2050 scenarios for 2035 by the NGFS. The following sections in this appendix will explore the three scenarios and the associated financial implications owing to physical and transition risks. 2 3 4 5 1 6 BRITISH COLUMBIA, CANADA • Increasing wildfire risk to site and regional infrastructure • Regional flooding impacts the ability to transport supplies and labor to site and concentrate to seaports Carbon Price Range (2035) $283 – $285/t CO 2 e • Increasing wildfire risk to site and regional infrastructure • Increasing water stress and drought risk Carbon Price Range (2035) $263 – $292/t CO 2 e • Use of freshwater increases water stress in the region among water users with the potential to cause conflict with local communities and drought risk • Increasing heat stress impacts on workforce Carbon Price Range (2035) $247 – $306/t CO 2 e • Use of freshwater increases water stress in the among regional water users • Increasing extreme precipitation Carbon Price Range (2035) $236 – $303/t CO 2 e • Increase in the number of high heat index days reduced labor productivity and/or increase costs to mitigate the heat impacts • Increasing wildfire risk Carbon Price Range (2035) $221 – $225/t CO 2 e • Increase in the number of high heat index days reduced labor productivity and/or increase costs to mitigate the heat impacts • Increasing water stress Carbon Price Range (2035) $212 – $292/t CO 2 e • Increasing water stress • Increasing wildfire risks • Increasing heat stress impacts on workforce Carbon Price Range (2035) $212 – $292/t CO 2 e • Wildfires threaten structures, regional infrastructure and movement of people and supplies Carbon Price Range (2035) $300 – $304/t CO 2 e • Increasing intensity and frequency of precipitation Carbon Price Range (2035) $285/t CO 2 e • Increasing frequency and severity of hurricanes • Increasing impacts from flooding • Increasing heat stress impacts on workforce • Increasing water stress Carbon Price Range (2035) $236 – $303/t CO 2 e • Extreme storms, including hurricanes • Flooding • Wildfires ACTUAL PHYSICAL RISKS • Water stress – drought • Water stress – variable precipitation • Heat stress CHRONIC PHYSICAL RISKS • Carbon pricing • Regulation & incentives • Technology TRANSITION RISKS WESTERN AUSTRALIA NGAMILAND, BOTSWANA WESTERN REGION, GHANA SÁNCHEZ RAMÍREZ, DOMINICAN REPUBLIC NORTHWEST ONTARIO, CANADA MATO GROSS, BRAZIL COQUIMBO, CHILE NORTHERN NEVADA ZACATECAS, MEXICO
 2022 ESG Report Page 118 Page 120