
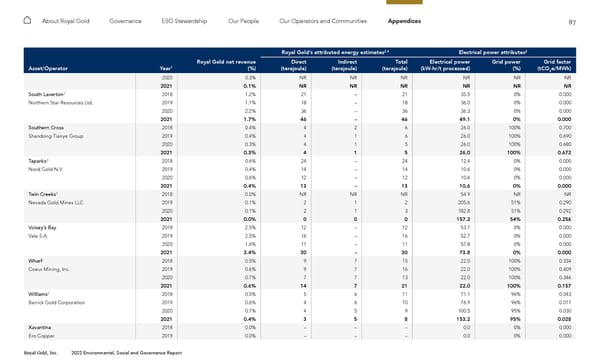
87 Royal Gold, Inc. 2022 Environmental, Social and Governance Report About Royal Gold Governance ESG Stewardship Our People Our Operators and Communities Appendices Royal Gold’s attributed energy estimates 2,4 Electrical power attributes 2 Asset/Operator Year 1 Royal Gold net revenue (%) Direct (terajoule) Indirect (terajoule) Total (terajoule) Electrical power (kW-hr/t processed) Grid power (%) Grid factor (tCO 2 e/MWh) 2020 0.3% NR NR NR NR NR NR 2021 0.1% NR NR NR NR NR NR South Laverton 3 2018 1.2% 21 – 21 35.5 0% 0.000 Northern Star Resources Ltd. 2019 1.1% 18 – 18 36.0 0% 0.000 2020 2.2% 36 – 36 36.3 0% 0.000 2021 1.7% 46 – 46 49.1 0% 0.000 Southern Cross 2018 0.4% 4 2 6 26.0 100% 0.700 Shandong Tianye Group 2019 0.4% 4 1 6 26.0 100% 0.690 2020 0.3% 4 1 5 26.0 100% 0.680 2021 0.3% 4 1 5 26.0 100% 0.672 Taparko 3 2018 0.6% 24 – 24 12.4 0% 0.000 Nord Gold N.V. 2019 0.4% 14 – 14 10.6 0% 0.000 2020 0.6% 12 – 12 10.6 0% 0.000 2021 0.4% 13 – 13 10.6 0% 0.000 Twin Creeks 3 2018 0.0% NR NR NR 54.9 NR NR Nevada Gold Mines LLC 2019 0.1% 2 1 2 205.6 51% 0.290 2020 0.1% 2 1 3 182.8 51% 0.292 2021 0.0% 0 0 0 157.2 54% 0.256 Voisey’s Bay 2018 2.5% 12 – 12 53.1 0% 0.000 Vale S.A. 2019 2.5% 16 – 16 52.7 0% 0.000 2020 1.6% 11 – 11 57.8 0% 0.000 2021 3.4% 30 – 30 73.8 0% 0.000 Wharf 2018 0.5% 9 7 15 22.0 100% 0.334 Coeur Mining, Inc. 2019 0.6% 9 7 16 22.0 100% 0.409 2020 0.7% 7 7 13 22.0 100% 0.346 2021 0.6% 14 7 21 22.0 100% 0.157 Williams 3 2018 0.5% 5 6 11 71.1 96% 0.043 Barrick Gold Corporation 2019 0.6% 4 6 10 76.9 96% 0.017 2020 0.7% 4 5 9 100.5 95% 0.030 2021 0.4% 3 5 8 153.2 95% 0.028 Xavantina 2018 0.0% – – – 0.0 0% 0.000 Ero Copper 2019 0.0% – – – 0.0 0% 0.000
 2022 ESG Report Page 86 Page 88