
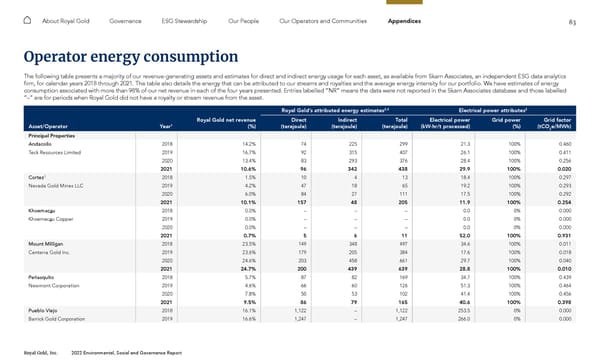
83 Royal Gold, Inc. 2022 Environmental, Social and Governance Report About Royal Gold Governance ESG Stewardship Our People Our Operators and Communities Appendices Operator energy consumption The following table presents a majority of our revenue-generating assets and estimates for direct and indirect energy usage for each asset, as available from Skarn Associates, an independent ESG data analytics firm, for calendar years 2018 through 2021. The table also details the energy that can be attributed to our streams and royalties and the average energy intensity for our portfolio. We have estimates of energy consumption associated with more than 98% of our net revenue in each of the four years presented. Entries labelled “NR” means the data were not reported in the Skarn Associates database and those labelled “–” are for periods when Royal Gold did not have a royalty or stream revenue from the asset. Royal Gold’s attributed energy estimates 2,4 Electrical power attributes 2 Asset/Operator Year 1 Royal Gold net revenue (%) Direct (terajoule) Indirect (terajoule) Total (terajoule) Electrical power (kW-hr/t processed) Grid power (%) Grid factor (tCO 2 e/MWh) Principal Properties Andacollo 2018 14.2% 74 225 299 21.3 100% 0.460 Teck Resources Limited 2019 16.7% 92 315 407 26.1 100% 0.411 2020 13.4% 83 293 376 28.4 100% 0.256 2021 10.6% 96 342 438 29.9 100% 0.020 Cortez 3 2018 1.5% 10 4 13 18.4 100% 0.297 Nevada Gold Mines LLC 2019 4.2% 47 18 65 19.2 100% 0.293 2020 6.0% 84 27 111 17.5 100% 0.292 2021 10.1% 157 48 205 11.9 100% 0.254 Khoemac a u 2018 0.0% – – – 0.0 0% 0.000 Khoemac a u Copper 2019 0.0% – – – 0.0 0% 0.000 2020 0.0% – – – 0.0 0% 0.000 2021 0.7% 5 6 11 52.0 100% 0.931 Mount Milligan 2018 23.5% 149 348 497 34.6 100% 0.011 Centerra Gold Inc. 2019 23.6% 179 205 384 17.6 100% 0.018 2020 24.6% 203 458 661 29.7 100% 0.040 2021 24.7% 200 439 639 28.8 100% 0.010 Peñasquito 2018 5.7% 87 82 169 34.7 100% 0.439 Newmont Corporation 2019 4.6% 66 60 126 51.3 100% 0.464 2020 7.8% 50 53 102 41.4 100% 0.456 2021 9.5% 86 79 165 40.6 100% 0.398 Pueblo Viejo 2018 16.1% 1,122 – 1,122 253.5 0% 0.000 Barrick Gold Corporation 2019 16.6% 1,247 – 1,247 266.0 0% 0.000
 2022 ESG Report Page 82 Page 84