
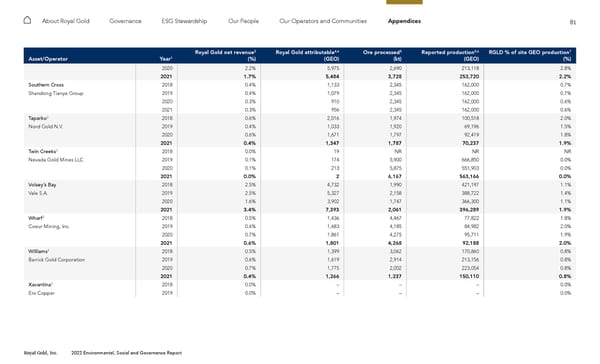
81 Royal Gold, Inc. 2022 Environmental, Social and Governance Report About Royal Gold Governance ESG Stewardship Our People Our Operators and Communities Appendices Asset/Operator Year 1 Royal Gold net revenue 2 (%) Royal Gold attributable 4,6 (GEO) Ore processed 5 (kt) Reported production 5,6 (GEO) RGLD % of site GEO production 7 (%) 2020 2.2% 5,975 2,690 213,118 2.8% 2021 1.7% 5,484 3,728 253,720 2.2% Southern Cross 2018 0.4% 1,133 2,345 162,000 0.7% Shandong Tianye Group 2019 0.4% 1,079 2,345 162,000 0.7% 2020 0.3% 910 2,345 162,000 0.6% 2021 0.3% 956 2,345 162,000 0.6% Taparko 3 2018 0.6% 2,016 1,974 100,518 2.0% Nord Gold N.V. 2019 0.4% 1,033 1,920 69,196 1.5% 2020 0.6% 1,671 1,797 92,419 1.8% 2021 0.4% 1,347 1,787 70,237 1.9% Twin Creeks 3 2018 0.0% 19 NR NR NR Nevada Gold Mines LLC 2019 0.1% 174 5,900 666,850 0.0% 2020 0.1% 213 5,875 551,903 0.0% 2021 0.0% 2 6,167 563,166 0.0% Voisey’s Bay 2018 2.5% 4,732 1,990 421,197 1.1% Vale S.A. 2019 2.5% 5,327 2,158 388,722 1.4% 2020 1.6% 3,902 1,747 366,300 1.1% 2021 3.4% 7,393 2,061 396,289 1.9% Wharf 3 2018 0.5% 1,436 4,467 77,822 1.8% Coeur Mining, Inc. 2019 0.6% 1,683 4,185 84,982 2.0% 2020 0.7% 1,861 4,275 95,711 1.9% 2021 0.6% 1,801 4,268 92,188 2.0% Williams 3 2018 0.5% 1,399 3,062 170,860 0.8% Barrick Gold Corporation 2019 0.6% 1,619 2,914 213,156 0.8% 2020 0.7% 1,775 2,002 223,054 0.8% 2021 0.4% 1,266 1,237 150,110 0.8% Xavantina 9 2018 0.0% – – – 0.0% Ero Copper 2019 0.0% – – – 0.0%
 2022 ESG Report Page 80 Page 82