
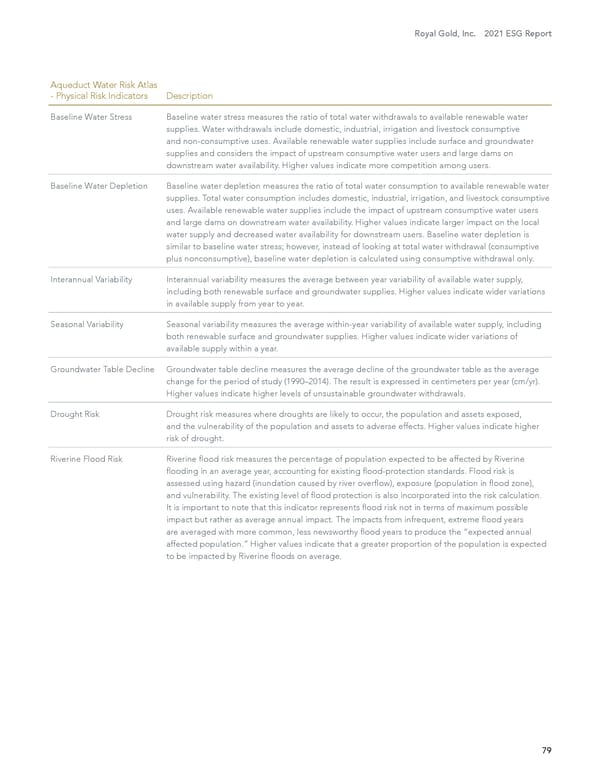
Royal Gold, Inc. 2021 ESG Report 79 Aqueduct Water Risk Atlas - Physical Risk Indicators Description Baseline Water Stress Baseline water stress measures the ratio of total water withdrawals to available renewable water supplies. Water withdrawals include domestic, industrial, irrigation and livestock consumptive and non-consumptive uses. Available renewable water supplies include surface and groundwater supplies and considers the impact of upstream consumptive water users and large dams on downstream water availability. Higher values indicate more competition among users. Baseline Water Depletion Baseline water depletion measures the ratio of total water consumption to available renewable water supplies. Total water consumption includes domestic, industrial, irrigation, and livestock consumptive uses. Available renewable water supplies include the impact of upstream consumptive water users and large dams on downstream water availability. Higher values indicate larger impact on the local water supply and decreased water availability for downstream users. Baseline water depletion is similar to baseline water stress; however, instead of looking at total water withdrawal (consumptive plus nonconsumptive), baseline water depletion is calculated using consumptive withdrawal only. Interannual Variability Interannual variability measures the average between year variability of available water supply, including both renewable surface and groundwater supplies. Higher values indicate wider variations in available supply from year to year. Seasonal Variability Seasonal variability measures the average within-year variability of available water supply, including both renewable surface and groundwater supplies. Higher values indicate wider variations of available supply within a year. Groundwater Table Decline Groundwater table decline measures the average decline of the groundwater table as the average change for the period of study (1990–2014). The result is expressed in centimeters per year (cm/yr). Higher values indicate higher levels of unsustainable groundwater withdrawals. Drought Risk Drought risk measures where droughts are likely to occur, the population and assets exposed, and the vulnerability of the population and assets to adverse effects. Higher values indicate higher risk of drought. Riverine Flood Risk Riverine flood risk measures the percentage of population expected to be affected by Riverine flooding in an average year, accounting for existing flood-protection standards. Flood risk is assessed using hazard (inundation caused by river overflow), exposure (population in flood zone), and vulnerability. The existing level of flood protection is also incorporated into the risk calculation. It is important to note that this indicator represents flood risk not in terms of maximum possible impact but rather as average annual impact. The impacts from infrequent, extreme flood years are averaged with more common, less newsworthy flood years to produce the “expected annual affected population.” Higher values indicate that a greater proportion of the population is expected to be impacted by Riverine floods on average.
 2021 Environment, Social and Governance Report Page 79 Page 81