
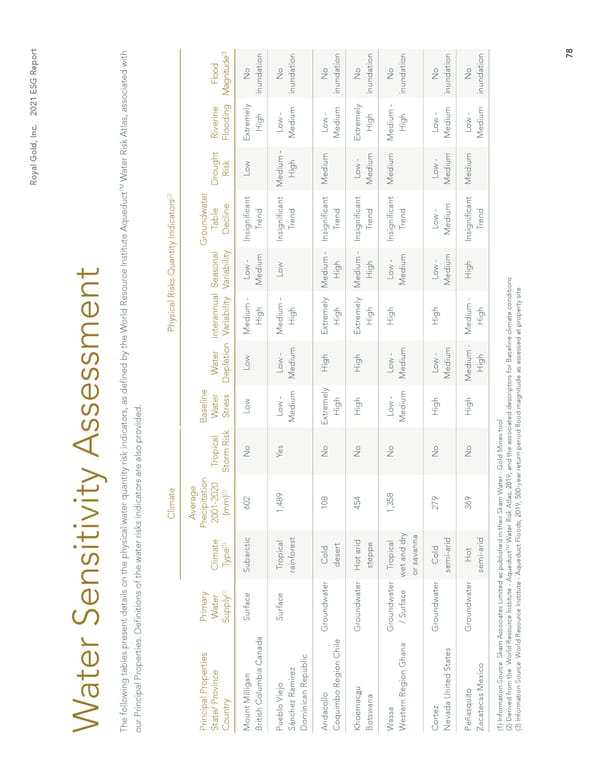
78 Royal Gold, Inc. 2021 ESG Report Water Sensitivity Assessment The following tables present details on the physical water quantity risk indicators, as defined by the World Resource Institute Aqueduct TM Water Risk Atlas, associated with our Principal Properties. Definitions of the water risks indicators are also provided. Climate Physical Risks Quantity Indicators (2) Principal Properties State/ Province Country Primary Water Supply(1) Climate Type (1) Average Precipitation 2001-2020 (mm) (1) Tropical Storm Risk Baseline Water Stress Water Depletion Interannual Variability Seasonal Variability Groundwater Table Decline Drought Risk Riverine Flooding Flood Magnitude (3) Mount Milligan British Columbia Canada Surface Subarctic 602 No Low Low Medium - High Low - Medium Insignificant Trend Low Extremely High No inundation Pueblo Viejo Sánchez Ramirez Dominican Republic Surface Tropical rainforest 1,489 Yes Low - Medium Low - Medium Medium - High Low Insignificant Trend Medium - High Low - Medium No inundation Andacollo Coquimbo Region Chile Groundwater Cold desert 108 No Extremely High High Extremely High Medium - High Insignificant Trend Medium Low - Medium No inundation Khoemacau Botswana Groundwater Hot arid steppe 454 No High High Extremely High Medium - High Insignificant Trend Low - Medium Extremely High No inundation Wassa Western Region Ghana Groundwater / Surface Tropical wet and dry or savanna 1,358 No Low - Medium Low - Medium High Low - Medium Insignificant Trend Medium Medium - High No inundation Cortez Nevada United States Groundwater Cold semi-arid 279 No High Low - Medium High Low - Medium Low - Medium Low - Medium Low - Medium No inundation Peñasquito Zacatecas Mexico Groundwater Hot semi-arid 369 No High Medium - High Medium - High High Insignificant Trend Medium Low - Medium No inundation (1) Information Source: Skarn Associates Limited as published in their Skarn Water - Gold Mines tool (2) Derived from the World Resource Institute - Aqueduct TM Water Risk Atlas, 2019, and the associated descriptors for Baseline climate conditions (3) Information Source: World Resource Institute - Aqueduct Floods, 2019, 500-year return period flood magnitude as assessed at property site
 2021 Environment, Social and Governance Report Page 78 Page 80