
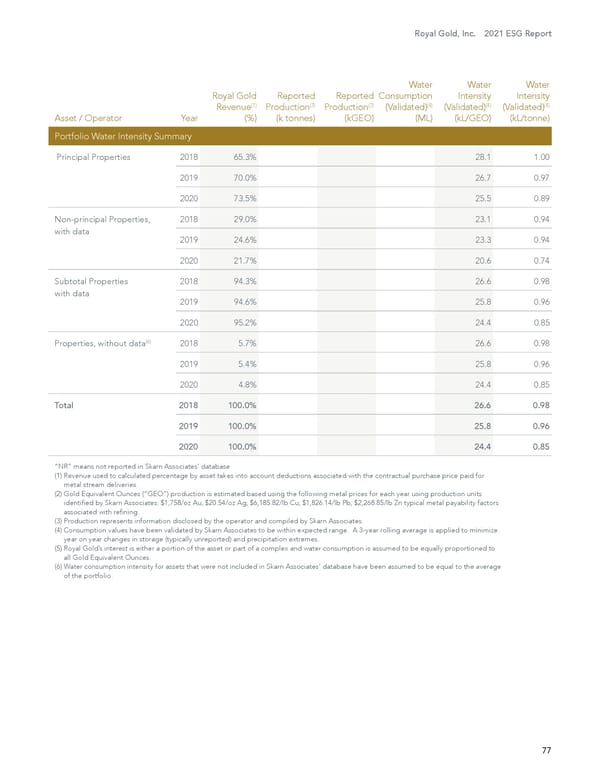
Royal Gold, Inc. 2021 ESG Report 77 Asset / Operator Year Royal Gold Revenue (1) (%) Reported Production (3) (k tonnes) Reported Production (2) (kGEO) Water Consumption (Validated) (4) (ML) Water Intensity (Validated) (4) (kL/GEO) Water Intensity (Validated) (4) (kL/tonne) Portfolio Water Intensity Summary Principal Properties 2018 65.3% 28.1 1.00 2019 70.0% 26.7 0.97 2020 73.5% 25.5 0.89 Non-principal Properties, with data 2018 29.0% 23.1 0.94 2019 24.6% 23.3 0.94 2020 21.7% 20.6 0.74 Subtotal Properties with data 2018 94.3% 26.6 0.98 2019 94.6% 25.8 0.96 2020 95.2% 24.4 0.85 Properties, without data (6) 2018 5.7% 26.6 0.98 2019 5.4% 25.8 0.96 2020 4.8% 24.4 0.85 Total 2018 100.0% 26.6 0.98 2019 100.0% 25.8 0.96 2020 100.0% 24.4 0.85 “NR” means not reported in Skarn Associates’ database (1) Revenue used to calculated percentage by asset takes into account deductions associated with the contractual purchase price paid for metal stream deliveries. (2) Gold Equivalent Ounces (“GEO”) production is estimated based using the following metal prices for each year using production units identified by Skarn Associates: $1,758/oz Au; $20.54/oz Ag; $6,185.82/lb Cu; $1,826.14/lb Pb; $2,268.85/lb Zn typical metal payability factors associated with refining. (3) Production represents information disclosed by the operator and compiled by Skarn Associates. (4) Consumption values have been validated by Skarn Associates to be within expected range. A 3-year rolling average is applied to minimize year on year changes in storage (typically unreported) and precipitation extremes. (5) Royal Gold’s interest is either a portion of the asset or part of a complex and water consumption is assumed to be equally proportioned to all Gold Equivalent Ounces. (6) Water consumption intensity for assets that were not included in Skarn Associates’ database have been assumed to be equal to the average of the portfolio.
 2021 Environment, Social and Governance Report Page 77 Page 79